

Overview: Industry margin in Practice
This article from Revology Analytics explains industry margin in the context of modern pricing analytics and revenue growth management. It draws on real engagements with mid-market and enterprise clients to turn industry margin from a buzzword into a measurable commercial capability. Read on for the full perspective, and see our related reading for additional depth.
Table of Contents
At its very basic level, industry margin pools help you understand what share of the total profits goes to each supply chain participant, from Manufacturer, Distributor, to Retailer.
For a single Product sale that traverses from a Manufacturer, a Distributor, a Retailer, and to the end consumer, the total profit pool is:
Consumer Price @ Retail – COGS @ Manufacturer
Imagine you are a manufacturer of, let’s say, consumer electronics. You typically sell through specialty distributors who ship your products to retailers (who then sell to consumers).
For a while, you’ve had this hypothesis that your retail, especially distributor partners, only partially pass on your Promotional Price Discounts to their customers in the value chain.
Luckily, you’ve had access to syndicated Retailer data and have started collecting Point-of-Sale data from some of your crucial Distributor partners. Your excellent BI team created an integrated data set that harmonized your transactional data with Distributor depletion (to Retailers) and Retailer sell-out data (to Consumers).
You ran the numbers and found the following:
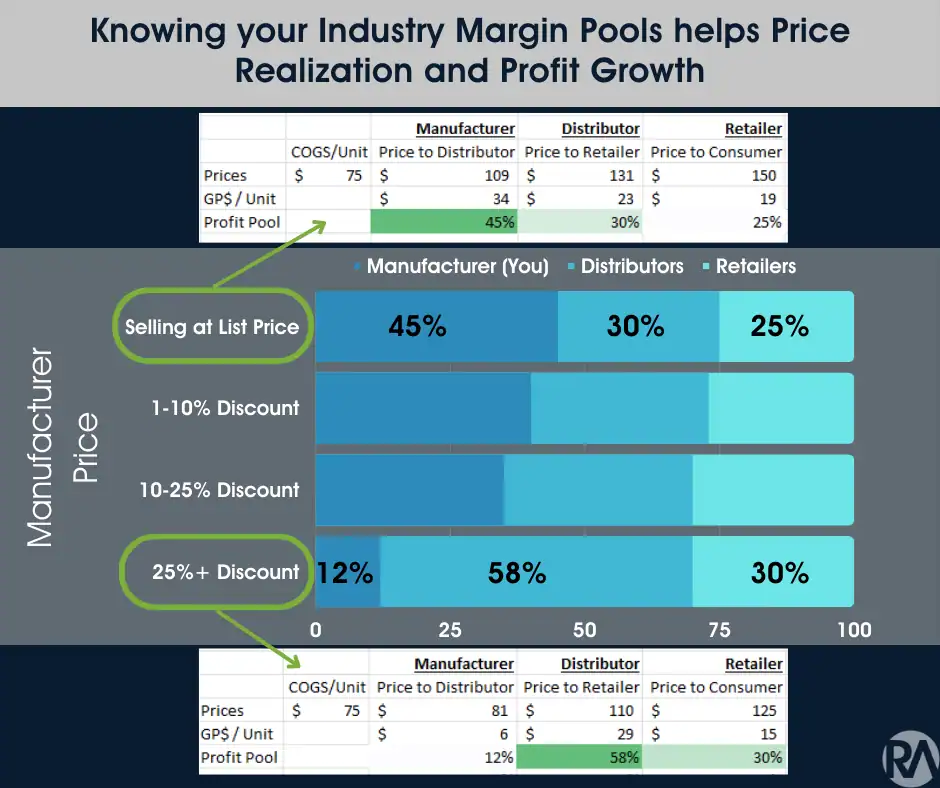
When you sell your products at or near List Price, you keep 45% of the total profit pool, with 30% going to Distributors and another 25% to Retailers. That’s in line with industry benchmarks, which put Manufacturer profit pools in the ~ 50% range.
In contrast, when you have deep price promotions at 25%+ discounts (which happens a few days each month), your share of the profit pool drops to 12%. Your Distributor partners are saying “thank you” to your price investment and pocketing it (their share of the profit pool increases from 30% to 58%).
The above is a slightly over-dramatized example, but this sort of margin imbalance frequently occurs in B2B industries and is usually driven by:
Information asymmetry: Retailers or Distributors are much closer to the end customer, have the critical customer/consumer data, and have a better sense for promotional elasticities or critical pricing thresholds.
Imbalance in Pricing / Margin Analytics capabilities: there are many industries where Manufacturers have a weaker tech stack or analytical acumen than their Distributor partners. Therefore, distributors or retailers have more reliable scenario analytics capabilities that may suggest passing on only 50% of the Manufacturer’s price investment.
Different goals/motivations between value chain participants: the Manufacturer may want to push units out the door to steal market share or get rid of unwanted inventory, while the Distributor may incent their sales team based on 80% Gross Profits and 20% on Net Revenue.
Lack of proper promotion event coordination between Manufacturers, Distributors, and Retailers
Rogue behavior (“thanks for your price investment – I’ll keep most of it): this happens the least frequently.
Knowing how your share of the margin pool compares with others in the value chain and how it changes by product, customer segment, or time of year helps you become more surgical about your price investments.
Being “surgical” can mean many things:
You may readjust your promotional investments, knowing that your distributors or retailers won’t make any additional investments below a specific price level.
You could eliminate specific price promotions as downstream partners are not passing on price investments as expected (and the promotional ROI is highly negative).
You may use it as leverage to seek guaranteed-length contracts with your distributor or retail partners.
You could explore offering direct-to-consumer promotions or rebates, bypassing your value chain participants entirely (risky!), or partially funding B2B promotions to distributors/retailers, with the rest as B2C promos/rebates.
Frequently asked questions about industry margin pools
What is an industry margin pool?
At its most basic level, an industry margin pool shows what share of total profit goes to each supply chain participant, from manufacturer to distributor to retailer. For a single product sold through that chain to the end consumer, the total profit pool is the consumer price at retail minus the cost of goods sold at the manufacturer.
How can price promotions shift the margin pool?
In the example, a consumer electronics manufacturer selling at or near list price keeps 45% of the profit pool, with 30% going to distributors and 25% to retailers, in line with benchmarks of about 50% for manufacturers. During deep promotions of 25% or more, its share drops to 12%, while distributors pocket the discount and their share rises from 30% to 58%.
Why don’t distributors pass promotional discounts on to customers?
The usual drivers are information asymmetry, since distributors and retailers are closer to end customers and understand promotional elasticities and price thresholds better; stronger pricing analytics at distributors than at manufacturers; different goals, such as a manufacturer pushing volume while a distributor pays its sales team mostly on gross profit; poor promotion coordination; and, least often, rogue behavior.
How do you measure your share of the margin pool?
Harmonize your own transactional data with distributor depletion data to retailers and retailer sell-out data to consumers, using syndicated retailer data and point-of-sale data from key distributor partners. The integrated data set shows how your share of the profit pool compares with other participants and how it changes by product, customer segment, or time of year.
How can manufacturers act on margin pool insights?
Use them to become more surgical with price investments. Readjust promotional investments where partners will not go below a certain price, drop promotions that partners do not pass on and that carry highly negative ROI, and use the insight to push for guaranteed-length contracts. You can also explore direct-to-consumer promotions or rebates, which is risky, or split funding between B2B and B2C promotions.
Related Reading
- RA Quick Insights: Using Discount Curve Analysis to Evaluate Pricing Behavior
- Revenue and Profit Growth Drivers: A Foundational Revenue Growth Analytics Capability
For broader industry perspective on pricing analytics and revenue growth management, see McKinsey’s Growth, Marketing & Sales insights.






