Does your business feel like it’s running harder than ever but not getting ahead? You see top‑line revenue climbing, yet margins feel perpetually squeezed. This frustrating dynamic, where the engine is revving but the wheels seem to spin, is often a symptom of The Portfolio Trap—a situation where a product portfolio that looks healthy on the surface is secretly being drained by money‑losing SKUs hiding in plain sight.
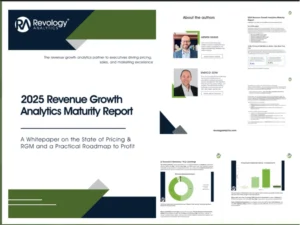
This is a widespread reality confirmed by hard data. The 2025 Revenue Growth Analyti cs (RGA) Maturity Report from Revology Analytics surveyed dozens of commercial leaders and painted a stark picture: a staggering 50 % of organizations are stuck in a “Medium” analytics‑maturity level, with a mere 2% achieving true excellence. This is the definition of being “data‑rich but insights‑poor,” creating the perfect conditions for the Portfolio Trap to take hold.
 1")
A second, equally sobering benchmark comes from a landmark 2022 research study on category management in distribution. Its analysis of 140 publicly traded distributors shows that every one‑percentage‑point improvement in cost‑of‑goods‑sold (COGS) expands EBITDA by 18 % or more, yet only a handful of “outperformers” capture that upside.
The report’s most telling discovery lies in one damning statistic from our own RGA study: over half of all businesses (51%) do not use a price waterfall. Let that sink in. A price waterfall is the most fundamental roadmap for tracking every discount, rebate, and fee that bleeds value from a product’s list price down to the final pocket price. Without it, leaders are effectively blind; they can’t see the very leaks that turn a promising SKU into a financial drain.
 2")
This blindness is compounded by a systemic reliance on outdated assumptions. The RGA data reveals that the vast majority of companies are guess‑pricing: over 75 % still use archaic “cost‑plus” or subjective pricing methods that ignore the true variable costs of marketing, fulfillment, and returns. Even worse, 63 % of companies cannot quantify promotion ROI, and nearly 70 % of commercial teams don’t know their marketing‑spend ROI at all.
That is the essence of the Portfolio Trap—celebrating high‑volume SKUs whose untracked discounts, rebates, and service costs quietly erode the bottom line.
The SKU Profitability Black Hole
The core problem is that most businesses are flying blind at SKU level. Leaders glance at a P&L, see a reasonable gross‑margin average, and stop there. They miss the in‑portfolio variance—“hero” SKUs earning 60 % margin beside “zombie” SKUs draining –10 %. According to the same 2022 study, inadequate category insight means many category teams “react to sales requests and supplier priorities rather than shape their assortment.”
Deconstructing the Portfolio Trap
The Trap is a cascade of issues created by poor visibility:
-
The High‑Volume Illusion – High revenue ≠ high profit when variable costs remain hidden.
-
The Mix‑Management Blind Spot – Over time, sales migrate toward lower‑margin SKUs without anyone noticing.
The 2022 distribution study lays out three pillars for escaping this trap:
 3")
 4")
The Consequences of Inaction
Internal friction, wasted resources, flawed strategic choices, and eroding competitiveness await companies that leave the Trap untouched.
The Solution: The True Profitability Framework
Escaping the Trap demands a shift from aggregated metrics to granular truth:
-
Shift the Goalpost—from Revenue to SKU‑Level Net Profit.
-
Institute Proactive Mix & Cross‑Sell Management.
-
Establish a Single Source of Truth.
These principles map directly to the study’s five value levers:
 5")
Revify: The Engine for True Profitability
A framework is only as strong as the platform that powers it. Revify—a Revenue Growth Management‑as‑a‑Service (RGMaaS) solution purpose‑built for the mid‑market—automates each pillar:
1. Product Assortment Optimization
Revify’s new Assortment Optimization module implements the exact four‑bucket logic that the 2022 study recommends and our data science team has codified:
 6")
How it works
-
ITE score blends revenue share, gross‑margin share, and optional strategic weightings.
-
ITC score blends buyer reach and purchase frequency.
-
Thresholds auto‑adjust by category and season, and results appear on a dynamic 2×2 quad chart.
2. Profit & Revenue Drivers
Our dashboard decomposes performance into price, volume, cost, and mix, providing unrivaled transparency into the P&L drivers.
3. Product Affinity & Cross‑Sell Analytics
Built‑in Apriori/FP‑Growth logic flags “white‑space” gaps—customers who buy Item A but should buy profitable Item B—arming reps with precise, margin‑accretive recommendations.
4. Single Source of Truth
Revify ingests POS, ERP, web‑shop, and rebate data, standardizes it, and surfaces identical insights to Finance, Sales, and Supply‑Chain teams—ending the spreadsheet swamp and enabling unified action.
Evidence in Action: A Tale of Two Approaches
 7")
Stop Chasing Empty Revenue—Start Managing for Profit
Chasing top‑line revenue while ignoring SKU‑level profitability is like running in circles. The cost of inaction is not just lost profit; it is a slow erosion of competitive edge and internal alignment.
The 2022 distribution study reminds us that companies who master category management widen the gap on laggards every year. Revify provides the engine to apply that playbook in weeks, not months, by exposing—and then fixing—the hidden drags in your assortment.
Ready to escape the Portfolio Trap? See how Revify delivers SKU‑level clarity and category excellence—request a personalized demo today.