
The Distributor’s Playbook for Growing Share of Wallet
How Guided Purchase Intelligence Unlocks Cross‑Sell Opportunities
Let’s be frank: most distributors are under-earning on their best accounts. Despite solid relationships and consistent order volumes, you have blind spots in your product mix, discounting habits, and price realization vs. cost inflation tracking that are quietly siphoning profit from your P&L. We call this “a death by a thousand cuts” - a drain that traditional sales reports are not designed to detect. The fix is Purchase Intelligence, a disciplined framework combining smart analytics and guided sales activation that closes this gap and recaptures lost margin, and fast.
Our client diagnostic reviews with Revify consistently reveal the scale of this hidden opportunity, turning abstract problems into concrete dollars. For instance, at a mid-market manufacturer serving utility and industrial end-markets, we surfaced over $20 million in cross-sell upside, representing an estimated $10.2 million in gross margin. Similarly, for a mid-market distributor of plumbing and electrical supplies, hidden pricing practices were creating a ~$3.4 million annual headwind, while $2.4 million in untapped cross-sell upside sat hiding in a single core category.
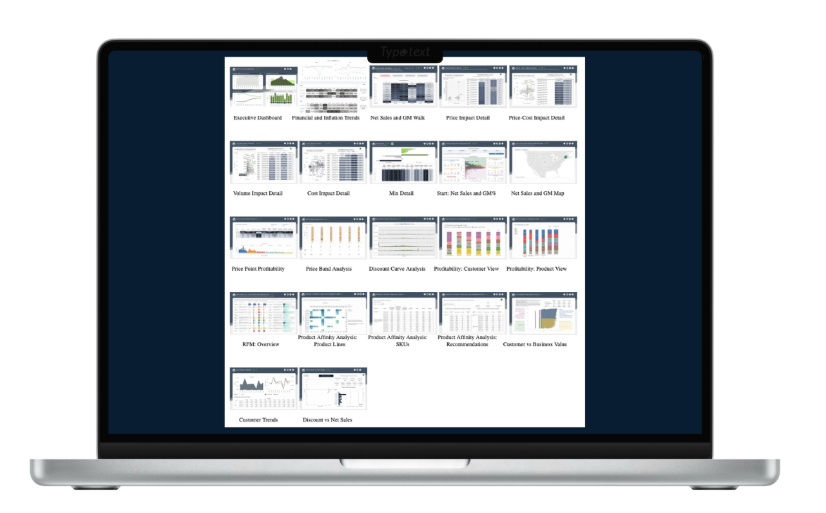
An arsenal of advanced Pricing & RGM Analytics at your fingertips with Revify.
The Problem Distributors Face (and Why Now)
Your best accounts buy from your competitors. That's a fact. In B2B distribution, multi-sourcing is the norm, and that gap—what they could be buying from you versus what they actually are—is your biggest and most accessible growth opportunity. The leakage begins with a series of seemingly small issues that compound into a massive drain on profitability. It’s the discount anchoring from a rep defaulting to a 30% discount; the cost-plus reflex that passes your sourcing efficiencies to the customer; the chaos of bad customer and product taxonomies data that obscures performance; and a weak retention discipline that only notices churn after it’s too late.
These issues create a reactive commercial culture. When a key account signals trouble, the default tool becomes "panic discounting," a tactical move that erodes long-term price realization and devalues your offerings. This constant firefighting prevents strategic thinking about an account's true potential, trapping your team in a perpetual state of defense. These individual leaks have always been a problem, but recent inflation has thrown gasoline on the fire. The margin for error is gone. Sequential price-cost drift now actively compresses your gross margins unless it is meticulously monitored and managed.
Just look at the numbers from our recent diagnostic analytics with Revify, which highlight this dangerous dynamic. A manufacturer saw price hikes add ~$900k YoY, but rising costs created a ~$300k headwind. Worse, in a flagship line, costs were outpacing prices, putting over ~$3.2M in future margin at risk. In another case, a distributor had a ~$3.4M price headwind, but they never felt it because ~$3.2M in cost productivity masked the damage—a classic case of cost-plus leakage where hard-won efficiencies were unknowingly passed straight to customers.
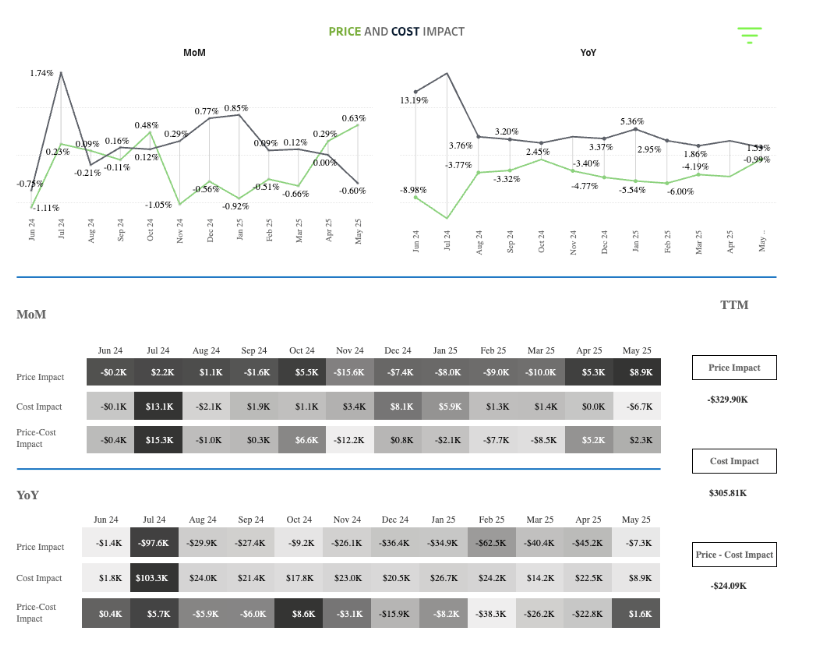
The Revify platform evaluates your Month-over-Month and Year-over-Year Price Realization and Cost Inflation trends before allowing you to dive deeper into the casuals.
What “Guided Purchase Intelligence” Means
To fix these systemic problems, you need more than another dashboard to check; you need a central nervous system for your commercial operations. It is defined as a unified view of your transaction, pricing, and customer data, layered with predictive sales analytics (propensity, elasticity, RFM risk), and delivered with guided execution through a Revenue Management as a Service model. It's designed to break down the data silos between Sales, Finance, and Operations that paralyze so many organizations, creating a single source of truth everyone can trust.
This framework is built on four core, interlocking blocks:
Data Health & Standards: It all starts with clean, reliable data—proper hierarchies and correctly matched returns and costs. This is the non-negotiable bedrock of any accurate predictive model, ensuring that the insights you act on are based on solid data.
Opportunity Engines: These are the brains of the operation. Machine learning models excel at finding the complex, non-linear patterns in purchasing behavior that a human analyst would miss, using algorithms to find cross-sell affinity, model price elasticity, and flag churn risk.
Guardrails: These keep every deal within a healthy, profitable lane through standardized discount tiers based on customer and product segments.
Sales Activation: This is where insight becomes action. The best analytics are useless if they aren't adopted. Instead of a complex dashboard, reps get a simple, prioritized call list integrated into their workflow: who to call, what to pitch, and why.
Field Diagnostics: What We Learned from Two Mid‑Market Pilots
When you apply this framework to real-world data, the results are eye-opening. Here are the findings from two recent diagnostics, showcasing the patterns of leakage we see time and again.
Price, Cost, and Price‑Cost Alignment
The gap between price and cost is where profitability lives or dies, especially in volatile markets.
We found that the manufacturer with the ~$3.2M forward risk also had a regional problem: some sales teams successfully implemented price increases and grew volume, while others raised prices but lost volume—a sure sign that customers were jumping ship to competitors who offered a better value proposition. Meanwhile, the distributor’s ~-$3.4M price headwind was largely funded by ~+$3.2M in cost productivity they were unknowingly passing on, a big incremental profit opportunity miss.
This lack of visibility prevents leaders from making informed strategic decisions. Without knowing which regions or customer and product segments can absorb price increases, companies are forced into ineffective, one-size-fits-all pricing strategies that either leave money on the table or alienate valuable customers.
Discounting Behaviors
Our analysis consistently reveals that discounting is a behavior, not a strategy. We found distinct clusters around round-number discounts and increments of 5% while dozens of official legacy tiers went unused. Reps were running on autopilot, defaulting to familiar numbers under pressure instead of using the tools at their disposal. This not only erodes margin on the immediate deal but also sets a dangerous precedent, training your most valuable clients that the best price comes after a negotiation, damaging future customer lifetime value.
This behavior is often a symptom of a deeper issue: a lack of confidence in the value proposition. When sales teams lack the data to defend a price, they fall back on the easiest lever to pull—the discount. Providing clear, data-backed guardrails empowers them to shift the conversation from price to value.
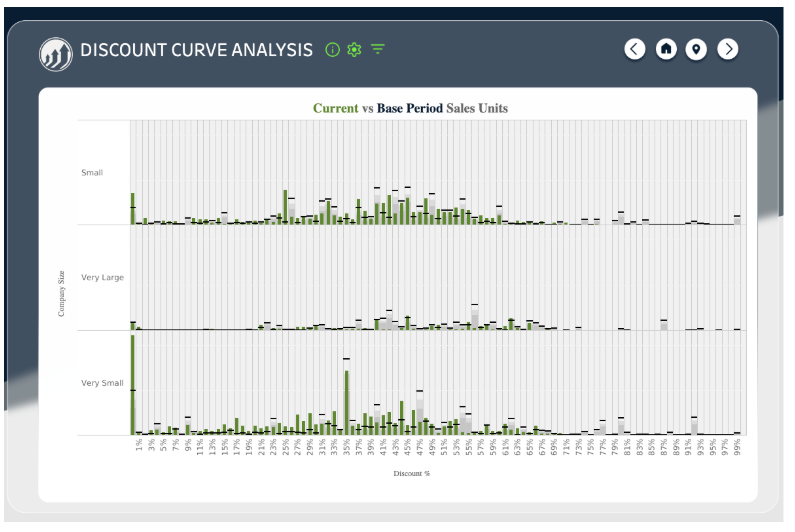
Revify’s Discount Curve Analysis shows you how discounting behavior has shifted over time and provides flexibility to view Discount Curves by customer, product and other hierarchies.
Mix & Data Governance (Hidden GM Driver)
You can't manage what you can't see. One pilot had an unclassified "NULL" bucket of ~$18.8M in TTM sales. It was a black hole of data, making it impossible to understand true product performance or assign accountability. Once we cleaned it up and properly classified the products, the product mix suddenly became a huge, manageable lever for improving gross margin, and sales groups could finally be held responsible for their portfolio's profitability.
Poor data governance is the root cause of countless strategic missteps. It leads to misallocated resources, ineffective marketing spend, and an inability to pinpoint true profit drivers. Establishing rigorous data standards isn't an IT project; it's a fundamental business requirement for any organization serious about data-driven decision-making.
Negative‑Margin & Low‑GM Business (Quick Wins)
Every company has a tail of deals that are barely profitable, creating a service drain that consumes resources for little return. The manufacturer had ~$1.2M in sales at low-teens GM; a phased price correction modeled a ~+$260k GM improvement with no volume loss. The distributor had ~$12M in sales below a 5% GM floor; moving it to the floor modeled a ~+$1.4M GM gain.
Addressing this long tail is often the fastest path to a meaningful margin lift. These are often legacy accounts with outdated pricing or low-volume products that are simply not worth the operational cost. A systematic approach allows you to make strategic decisions: either reprice the business to make it profitable, or consciously decide to walk away and refocus your resources on higher-potential accounts.
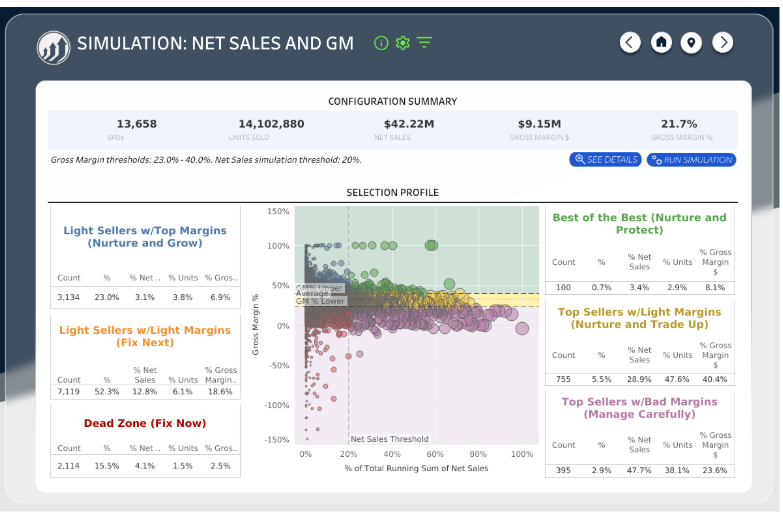
Revify’s Net Sales vs. GM% simulator allows the user to surgically adjust Pricing or Margins to understand the Volume, Revenue or Profit impacts of their actions.
Retention & At‑Risk Revenue (RFM)
The manufacturer had nearly a third of its accounts, worth ~$7.0M in healthy-margin revenue, flagged as "At Risk." The distributor’s showroom channel was losing ~$0.8M/mo from existing customers while only bringing in ~$0.4M/mo from new ones; RFM flagged ~$5.4M as At Risk. These are not just numbers; they represent relationships on the verge of collapse, often without any warning from traditional sales reports.
This silent churn is incredibly dangerous because it’s often invisible until it's too late. A customer's total annual spend might still look healthy, but a drop in purchasing frequency or a shift away from high-margin products are the early warning signs that a standard CRM won't catch. Proactive RFM analysis provides the leading indicators needed to intervene before the account is lost for good.
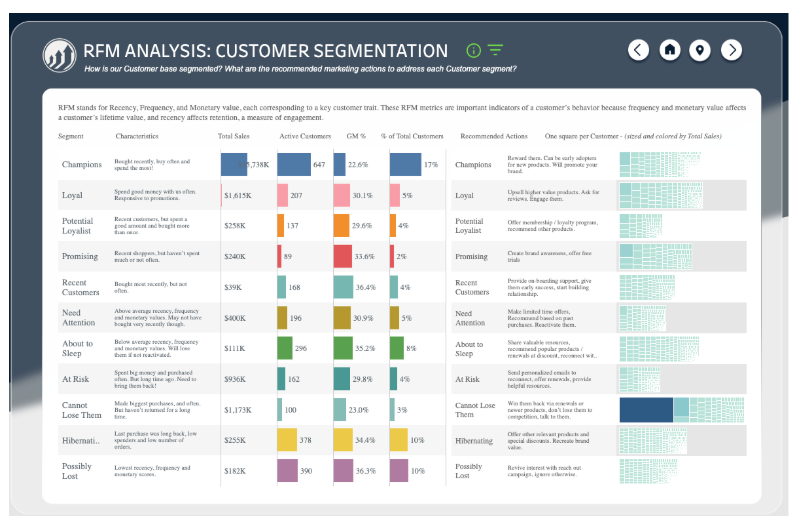
Detailed RFM Analysis enables Revify users to understand which accounts they need to nurture and pay attention to - either because they are about to churn, or because they are high value accounts that have become dormant for a while.
Product Affinity & Cross‑Sell Upside
This is where you shift from defense to offense and find real top-line growth. For the manufacturer, we found a ~$20M cross-sell opportunity (~$10.2M GM). For the distributor, it was ~$2.4M in annual upside, with ~$2.0M of it sitting in a single, core category they were overlooking. This is not about selling customers things they don't need; it's about identifying logical gaps in their purchasing based on the behavior of thousands of their peers.
This data turns a generic sales call into a strategic, value-added conversation. Instead of asking, "What else can I sell you?" a rep can say, "Customers who buy Product A also buy Product B to reduce downtime. Can we explore if that's a fit for you?" This consultative approach strengthens the relationship while simultaneously growing your share of wallet.

Revify makes specific customer and product level cross-sell and up-sell recommendations based on detailed Affinity Analysis. Sales managers can filter the opportunities for their specific territory or customer segments to view quantified sales opportunities.
The Distributor Playbook
A framework is only as good as its execution. This playbook provides a pragmatic, step-by-step process for turning these insights into measurable financial results, moving beyond ad-hoc initiatives into a structured, repeatable commercial rhythm.
Stabilize the Data (Week 1–2): Ingest and standardize everything. Fix cost/return alignment and enforce hierarchies.
From the field: Removing ~$1.08M in orphaned costs in one pilot materially clarified GM.
Quantify Wallet‑Share Gaps (Week 2–3): Run affinity analysis to find "buy X, should buy Y" opportunities. Rank them by margin and propensity.
From the field: The $20M and $2.4M opportunities surfaced almost instantly.
Design Discount Guardrails (Week 2–3): Collapse legacy tiers into a metal framework and enforce a simple price waterfall.
Correct Price‑Cost Drift (Weekly): Monitor the spread by segment and coach teams away from dollar-for-dollar cost chasing.
Activate Cross‑Sell (Week 3–4): Give reps a "Top 50" list with 3 specific gaps per account, including talk tracks and bundle pricing.
Protect the Base (Week 3–4): Use RFM to find wobbly customers and launch value-focused save plays.
Close the Loop (Weekly cadence): Track KPIs, analyze wins and losses, and update the models to make everyone smarter.
Adopting this playbook is about building a commercial flywheel where data fuels action, and action generates new data, creating a virtuous cycle of improvement. It’s the bridge between possessing powerful analytics and achieving measurable financial results.
How Revify Delivers This (RGMaaS: Platform + Experts)
We don't just hand you software and wish you luck. Traditional solutions often force a difficult choice: buy a complex software tool and figure it out yourself, or hire expensive consultants for a one-time project. Our RGMaaS model is the practical alternative for the mid-market, designed to get you from data to dollars through a straightforward, managed flow: Data Health & Onboarding → Engines → Guardrails → Sales Activation → Reviews.
This unique blend of technology and expertise ensures you're not just buying a tool, but a capability. You get insights and the activation plan. We provide the expert guidance to interpret the findings and coach your team on execution, ensuring the program delivers tangible ROI. We give your team the "who to call, what to pitch, and why now" so they can execute with confidence.

Revify provides both the advanced Pricing & RGM Analytics Platform, and the proven Pricing & RGM expertise to help your organization accelerate your Pricing journey. Monthly packages are flexible and affordable for any SMB looking to drive profitable growth and value creation.
The KPI Scorecard (Watch Weekly)
To drive change, you need to measure what matters. This scorecard moves beyond lagging indicators like quarterly revenue and focuses on the leading indicators of commercial health. These metrics create a common language and alignment across Sales, Finance, and Operations, ensuring everyone is working toward the same goals.
Wallet‑Share: Cross-sell conversion rate; incremental GM per account; bundle attach rate.
Pricing: Realized price vs. guardrail; Price-Cost spread by segment; off-guardrail leakage.
Discounting: Distribution of sales by tier; % of anchored deals; variance by sales group.
Retention: RFM segment shifts; Lost vs. New revenue; total saved revenue.
Data Health: Hierarchy completeness %; problem-transaction rate; % of "NULL" sales.
Benchmarks to emulate:
Lift bottom‑tail GM% to a clear floor.
Reduce anchored discounts by several points within 60 days.
Capture ≥30% of modeled cross‑sell upside from your Top 50 targets within 90 days.
Objections & De‑Riskers
“We tried cross‑sell lists.” → Static lists fail because they are outdated the moment they're printed. Ours are dynamic—updated weekly with propensity, margin, and inventory data. We add the coaching and talk tracks to ensure reps know how to turn the data into a conversation.
“We can’t raise prices.” → We're not talking about blanket increases. We're talking about surgical, elasticity-aware moves on products and customer segments that can handle it, backed by a solid value story that justifies the change. It's about precision, not brute force.
“Our data is messy.” → We know. Nearly every client starts here. Our first step is always a Data Health Check. We see fixing the foundation as part of the service, not a barrier to getting started.
“Reps won’t adopt dashboards.” → Good. We don’t give them one. We give them a prioritized, actionable call list that makes their job easier and helps them make more money. Adoption is achieved by providing direct value to the end-user, not by forcing another tool on them.
The growth you're chasing is already in your business. You just can't see it. Guided Purchase Intelligence systematically surfaces cross-sell opportunities, corrects costly discount habits, and ensures your pricing keeps pace with costs. It's the key to increase share of wallet and build a more profitable, resilient business.
Let’s explore how you can gain the clarity you’re looking for and build a more predictable, profitable path forward.
Get your field-ready playbook in about two weeks.
→ Book your diagnostic and put your existing customer base to work.
Subscribe to
Revology Analytics Insider
Revenue Growth Analytics thought leadership by Revology?
Use the form below to subscribe to our newsletter.