Revenue Growth Analytics Resources
-
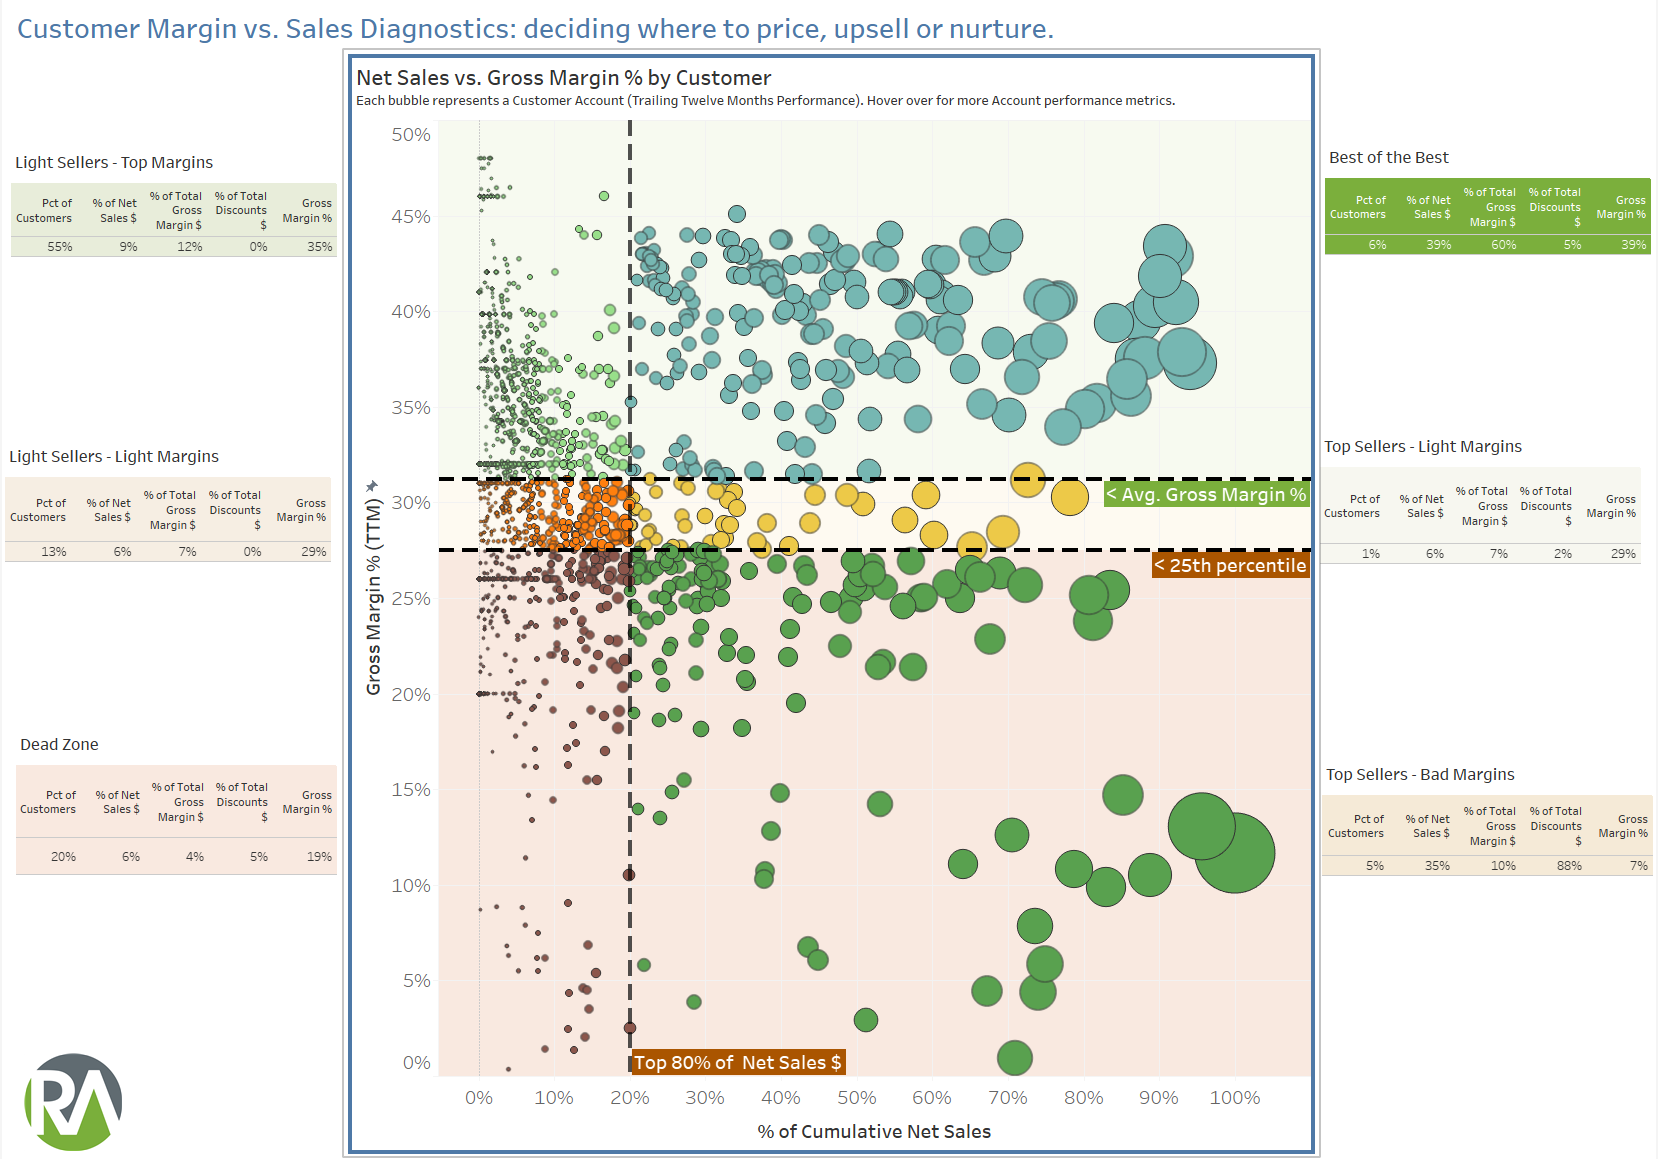
B2B Margin Analytics Dashboard Example 1 (Tableau)
Understand Win-Loss rates of your Sales Team, Margin performance outliers and the impact of fixing them, Discounting behavior, and Rep Performance Stack Ranking.
-
B2B Margin Analytics Dashboard Example 2 (Tableau)
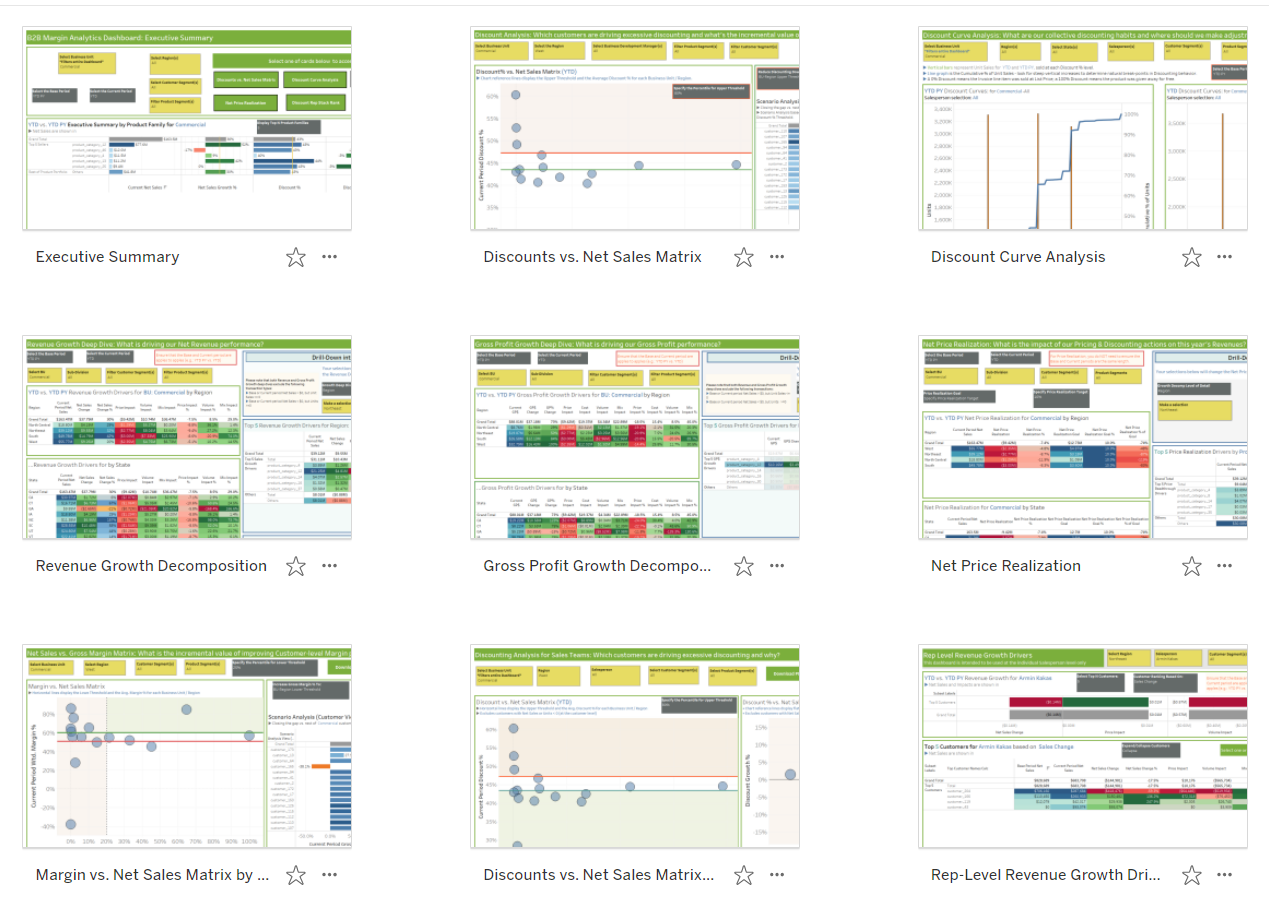
This Margin Analytics dashboard advances our webinar focused on the roadmap, strategy and execution around creating winning Margin Analytics & Optimization capabilities in B2B settings.
By interacting with the dashboard, we'll be able to answer critical business questions such as:
1. What are the Price, Cost, Volume, and Sales Mix drivers of my Gross Profit decline? What areas (Customers-Products) should we prioritize with the Sales team to address the gaps?
2. Who in the Sales team needs the most coaching on better Discount management?
3. What is the collective price discounting behavior of the sales team? What will happen to our Net Sales if we decrease our Discount Guidelines by -5% for Sales Directors?
4. Who in the Sales team has demonstrated the most effective Net Price Realization? What about positive Product Mix Management? What are the lessons learned that we can package together and translate to the rest of the Sales org?
5. Which Customer groups need the most attention to prevent further Gross Profit erosion? Which Customer groups should be priority #1 for net price increases? What is the impact of raising their GP% profile on the typical customer?
6. What is the Net Sales impact if we improve Customer discounts for the most highly discounted customers? What is driving their high discounts in the first place?
-
Price Elasticity Modeling for B2B Products (using R)
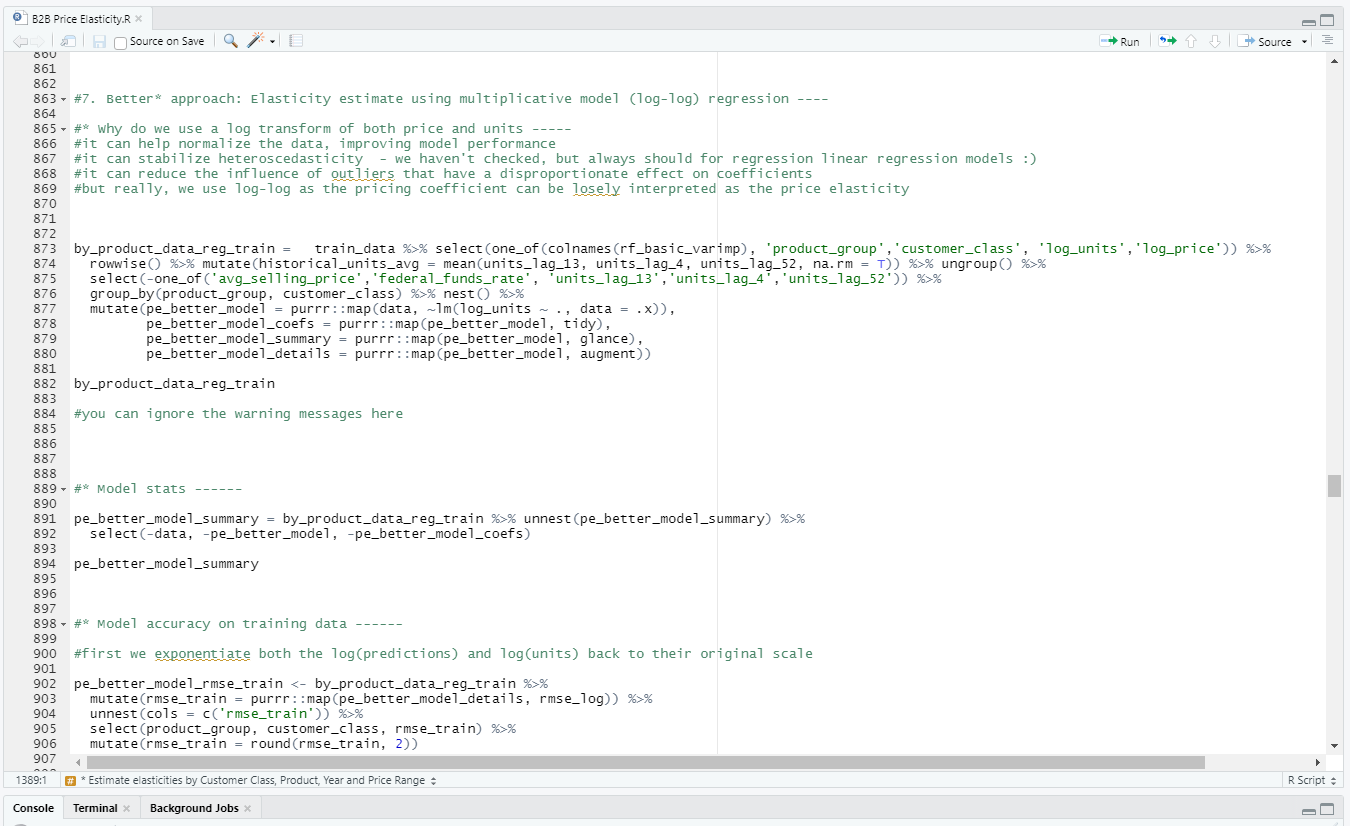
Good/Better/Best in Demand Modeling and Price Elasticity estimations using Linear Regression and Machine Learning approaches for large-ticket item sales in B2B settings (e.g. Manufacturer to Distributor).
The included R code details three Price Elasticity algorithms:
1. Linear Regression based mid-point method
2. Multiplicative Regression (log transformation)
3. Random Forest model using Price perturbations
Please visit our “Video Content” section to view the accompanying recorded webinar
“How to Build an Effective B2B Price Elasticity Model (in under 90 minutes)”.
-
Discount Curve Analysis (Tableau)
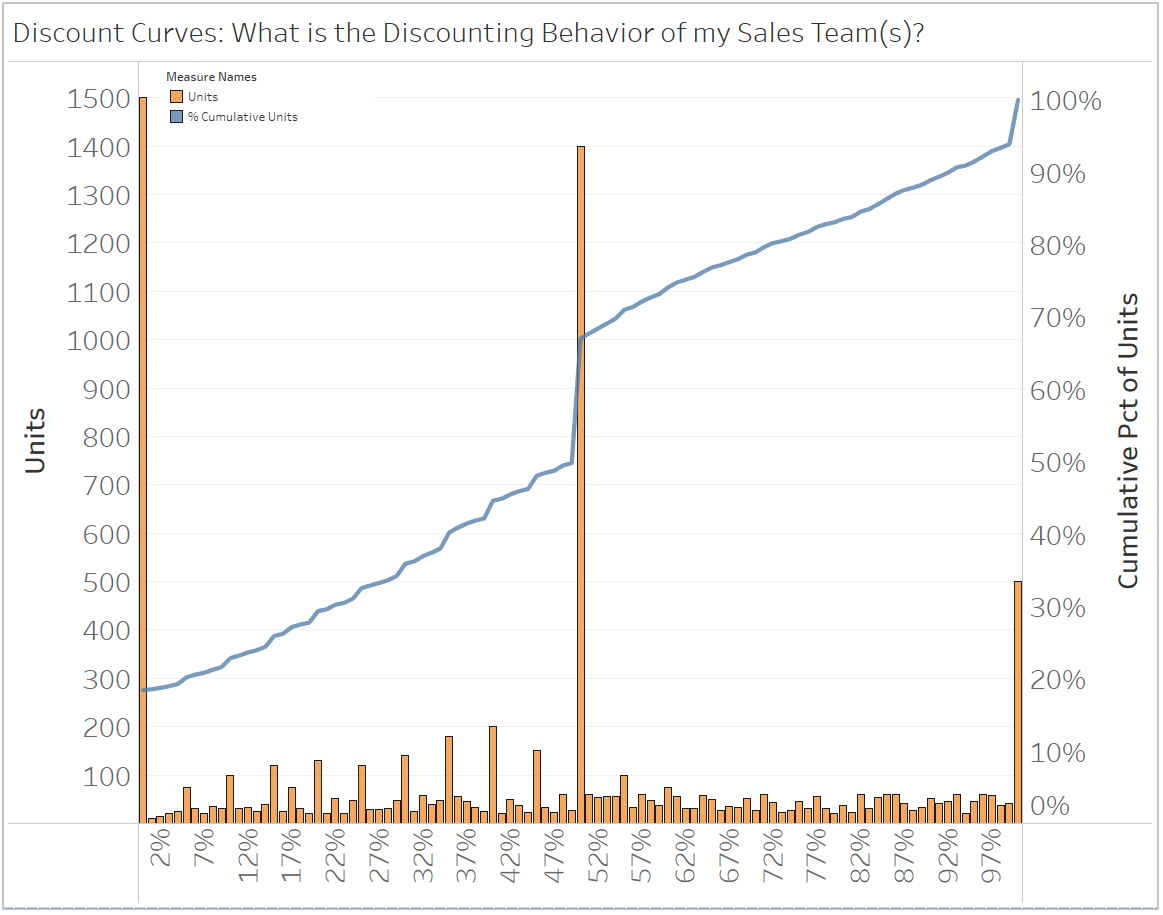
Use Discount Curve Analysis to understand your Sales team's collective price discounting behavior. Do we always offer Discounts up to our max allowable limit? Do we tend to offer Discounts in 5% increments?
-
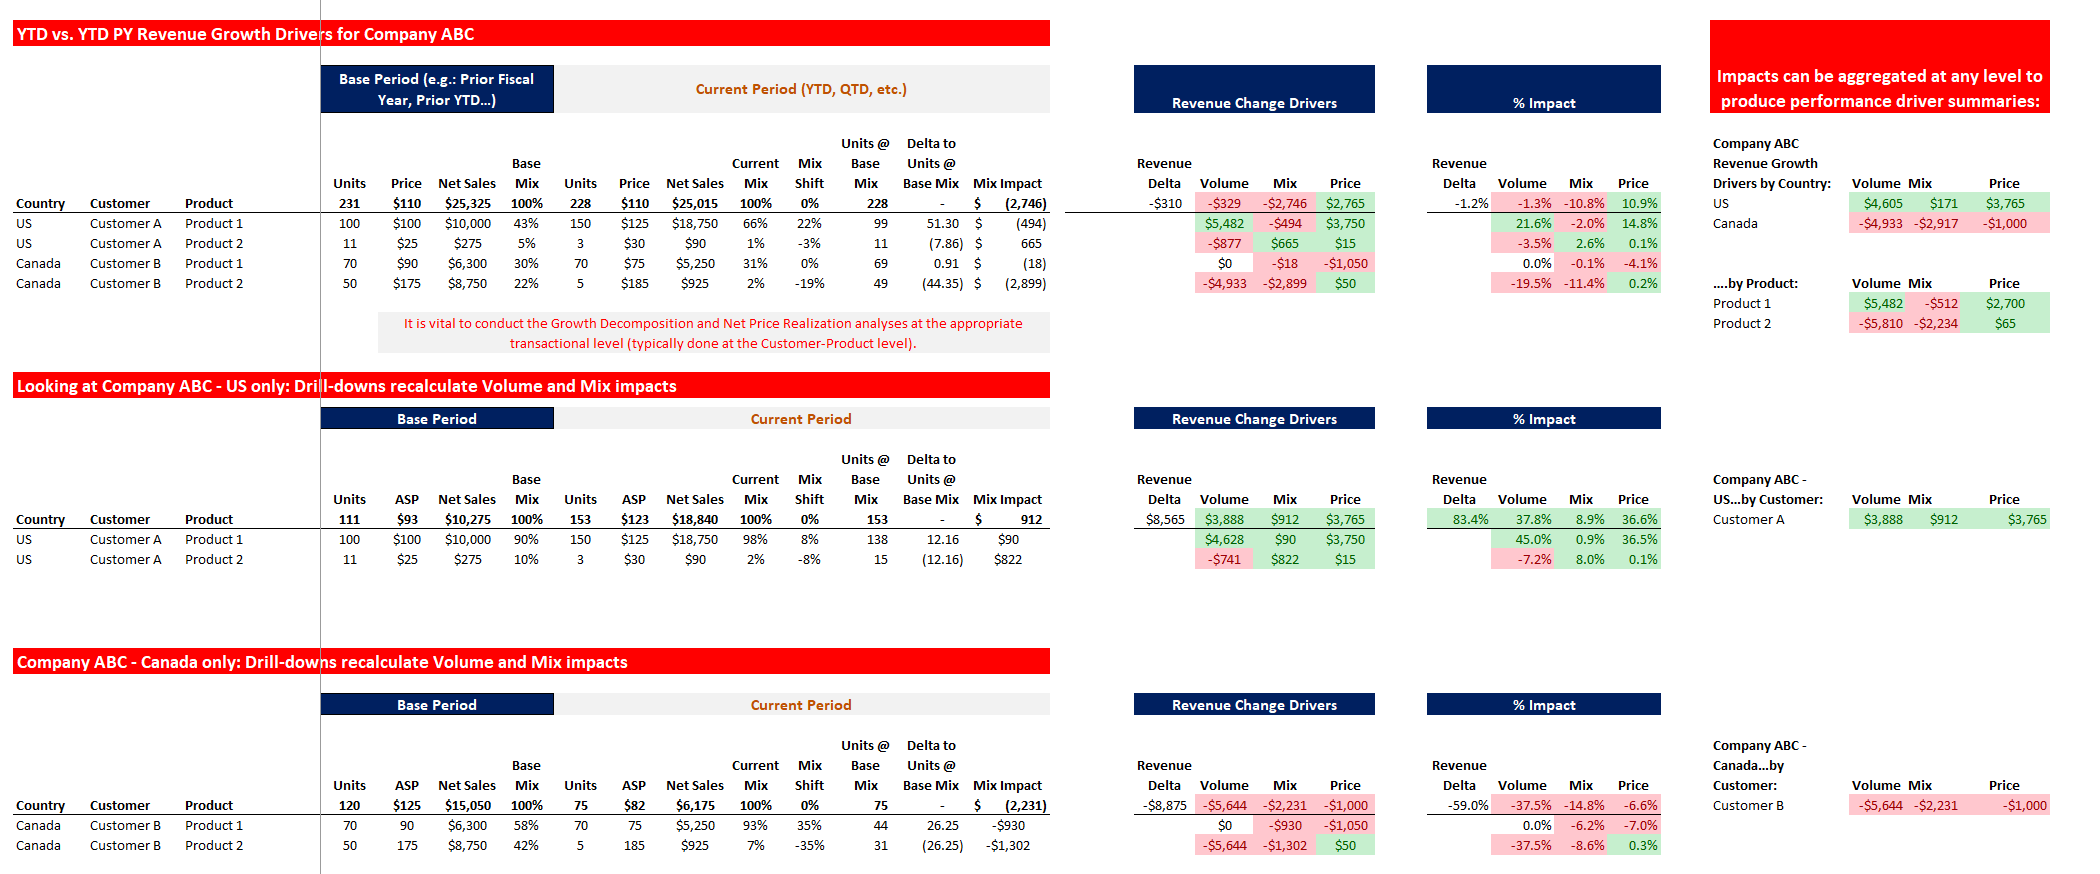
Growth Drivers Analysis (Excel)
Learn the detailed calculations behind the Price/Cost/Volume/Mix decomposition of Revenue and Gross Profit performance. For example: gain rapid insights on areas of your business that are not driving their fair share of Price Realization.
-
Gross Profit Growth Drivers Analysis (Tableau)
Understand the drivers of your Gross Profit growth, down to the Customer and Product level. See if your Pricing is keeping up with Inflation or if you are managing Customer or Product Mix profitably.

-
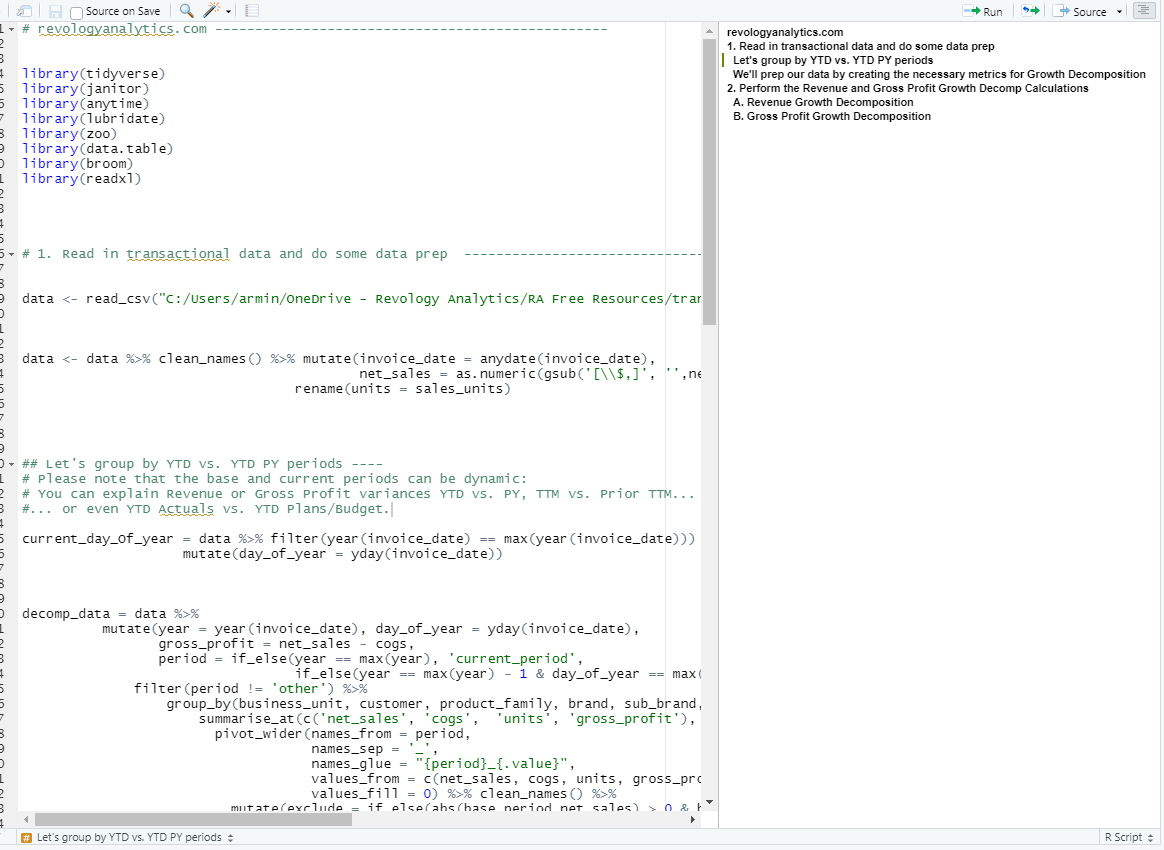
Growth Drivers Analysis (using R)
Sample code to perform dynamic Growth Decomposition of your Revenue and Gross Profit growth into Price, Cost, Volume, and Mix drivers, using simulated Transactional Data. Easily apply your company’s data to test, and export the final analytical data set for further analysis and insights.
-
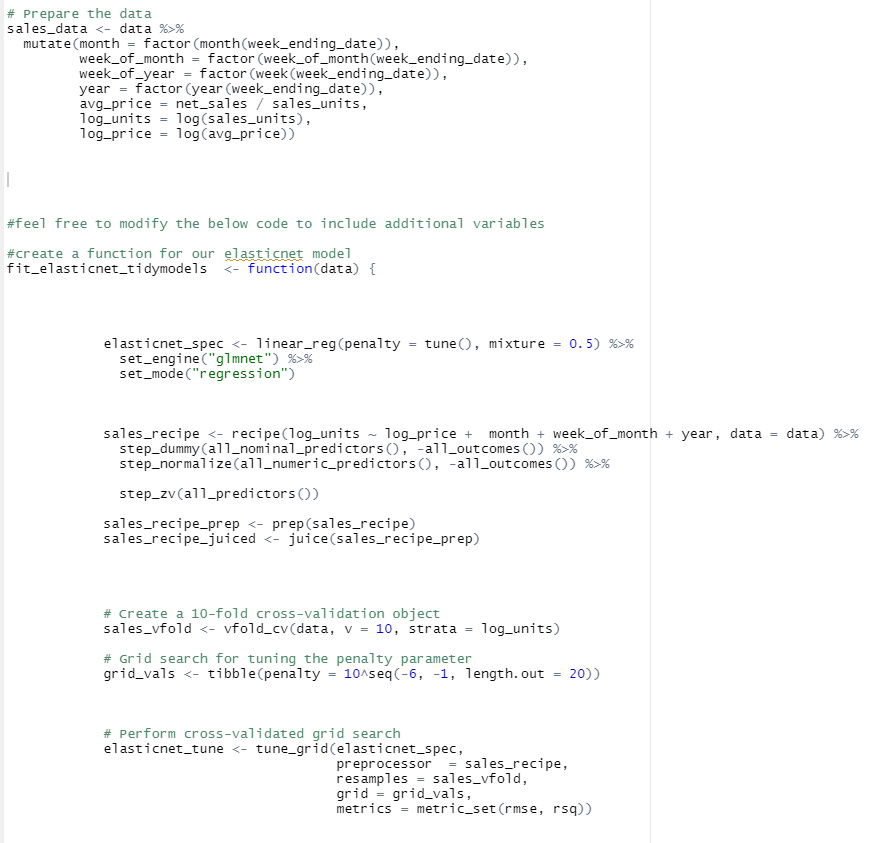
Price Elasticity Modeling with ElasticNet (using R and Python)
Explore a best-in-class approach for Demand Modeling and Price Elasticity estimations using Elastic Net—a blend of Linear Regression and Machine Learning techniques. Designed explicitly for small-ticket items in B2C settings (e.g., Retailer to Consumer), this price elasticity model facilitates a deeper understanding of pricing strategies and their impact on consumer demand. By analyzing store and product group-level price elasticities based on weekly sales and pricing data, our script provides valuable insights to help Retail and CPG analysts make better pricing decisions. You can download both the R and Python scripts and accompanying data.
-
Marketing Mix Modeling with R
This R script and associated presentation implement a sophisticated Marketing Mix Model (MMM) developed by Meta's innovative marketing science team (Robyn package).
This state-of-the-art package employs ridge regression and optimization models to extract the most value from your marketing data, delivering actionable insights into the efficiency and ROI of your marketing channels.
The model offers a granular understanding of how various marketing inputs affect sales outputs, enabling you to optimize your marketing budget allocation across different channels and campaigns.
By taking advantage of Robyn's capabilities, you can uncover hidden patterns, identify potential growth areas, and make data-driven marketing decisions, ultimately increasing the effectiveness of your marketing spending and driving business growth.
For more information on Robyn, please visit: https://facebookexperimental.github.io/Robyn/docs/analysts-guide-to-MMM

Guide: How To Build a B2B Margin Analytics & Optimization Platform (in under 90 days)
A detailed blueprint in Miro that guides you around building an impactful B2B Margin Analytics platform in under 90 days, from Problem Statement to Concept/Design, Deployment, and driving adoption and results.
This Miro board accompanies the “B2B Margin Analytics Dashboard Example 2” above.
