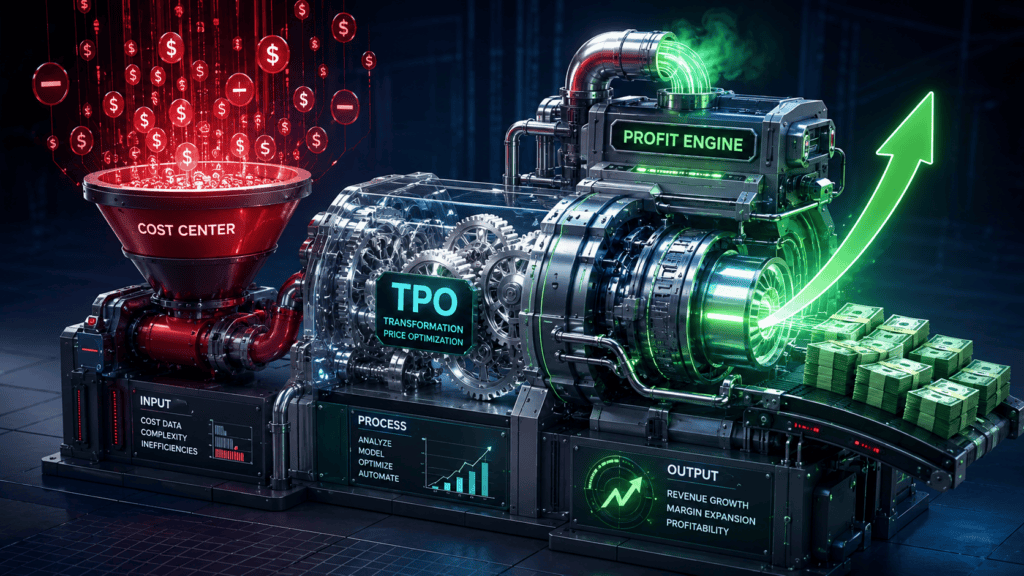
Competitive Analysis in 2026: Best Practices for Pricing and RGM Teams
By 2026, competitive analysis will shape more decisions than ever—from prices and promotions to e-commerce and sales bids. The most successful teams link competitor actions to their own results and act quickly to protect margin.
The named nemesis: “Screenshot-and-Spreadsheet” competitive analysis
If your team still uses screenshots, ad-hoc Excel files, and manual Amazon checks, you’re not alone. But this makes you vulnerable. In retail, prices can change several times a day, and tools exist to automate these updates. (The Wall Street Journal)
Critically, this isn’t just about digital changes. It leads to missed opportunities, including weeks spent below market price, lost margin due to discounts, and stalled debates due to mistrusted data.
Across the companies we’ve worked with, three patterns keep appearing:
A global consumer electronics company found its competitor tracking to be manual, reactive, and fragmented. Sales teams manually checked major retailers, and key metrics, such as the Competitive Price Index (CPI), resided in hard-to-update spreadsheets, which were challenging to align with market share.
A fast-growing beverage company had plenty of syndicated data but still spent six hours digging for a basic question: “Why are we down?” They couldn’t determine whether losses stemmed from their own price moves, competitor promotions, or distribution changes.
A global pharmaceutical company had many external sources and internal systems, but matching products across sources was tedious. They couldn’t reliably compare strength, pack size, and dosage form. Local teams often rejected the global set.
Importantly, these issues are not only about tools; they fundamentally impact how teams work together and collaborate across the organization.
The Importance of Competitive Analytics in Pricing & RGM for Consumer Electronics Companies.
Where competitive analysis usually breaks
Most competitive analysis failures in pricing and Revenue Growth Management (RGM) can be attributed to five key drivers.
1) Data capture is slow, incomplete, or channel-blind
Many teams can view list prices and visible shelf prices. They cannot see what matters:
“In-cart” discounts
coupons
bundles (“buy two” mechanics)
subscription discounts
price changes that are geo-targeted or customer-targeted
DTC moves that never hit retailers
If you do not know the price shoppers actually pay, you cannot manage your price position. You are only guessing.
2) Competitor prices are disconnected from your own performance data
Pricing leaders get asked: “Are we down because we raised price?” or “Are we losing share because a competitor ran a promo?”
If you do not connect competitor signals to your own sales, distribution, and promo calendar data, you are left guessing. This often leads to long meetings and defensive choices.
3) Product matching is fragile
In consumer goods, pack size, multipacks, and variants matter. In the pharmaceutical industry, differences in strength, pack size, and dosing often make price comparisons misleading. If teams do not trust the matching logic, they will not trust the analysis.
4) The competitive set is not governed
Global teams define competitors one way; local teams use another. Analysis is rejected not because of bad math, but because the market definition wasn’t agreed upon.
5) The output is “interesting” but not decision-grade
A monthly deck with market share, average prices, and competitor notes might be informative. It often doesn’t answer the commercial questions that matter:
Can we take price here?
Do we need to respond, or can we hold?
If we respond, what’s the expected volume and gross profit impact?
Where are we underpriced relative to the market (margin left on the table)?
Where are we overpriced in the segments that actually move volume?
This dynamic leads to a common challenge: pricing becomes reactive, and teams may treat competitor moves as cues for discounts. Such practices are often where margin leaks begin.
Solving the Competitive Analytics Challenge in Pharma Pricing.
The financial stakes in plain language
Pricing is a profit lever precisely because small price changes cascade through the P&L.
For decades, leaders repeated the classic benchmark that a 1% price gain yields an 11.1% operating profit improvement. Revology Analytics revisited that question using contemporary data from approximately 2,000 public companies and found that pricing still produces one of the most dependable profit impacts. However, the median operating profit lift from a 1% net price realization improvement is about 6.4% across industries.2025 Revenue Growth Analytics M…
That profit effect is not uniform. Revology’s analysis shows medians ranging from about 17.4% (Automotive) to ~9.4% (Industrials) and ~9.2% (Consumer Staples), with lower medians in sectors such as Utilities (~4.4%), Real Estate (~3.1%), and Financial Services (~2.2%).2025 Revenue Growth Analytics M…
This is why competitive analysis should be integrated into the pricing execution process. If your competitive view is late or incomplete, and you match price when you do not need to, the margin damage can be lasting. If you miss a moment when the market moves up, and you could have held or taken a price, you leave profit on the table.
Revology’s 2025 Revenue Growth Analytics Maturity Report also suggests there is plenty of headroom: half of the respondents rated their overall pricing and RGM analytics maturity as “Medium,” and 71% said their competitive price tracking remains ad-hoc or scattered.2025 Revenue Growth Analytics M…
The Power of the 1%
Revology’s updated Pricing Power analysis in 2025 - a global study of ~ 2,000 companies.
What “good” competitive analysis looks like in 2026
In 2026, competitive analysis should do three things well:
Provide trustworthy price position (by segment, channel, and geography)
Explain performance movement quickly (“Why are we down?”)
Support decisions (scenario analysis, guardrails, and a repeatable cadence)
If competitive analysis doesn’t improve decision speed and quality, it’s just reporting.
The 2026 competitive signal stack
The best teams treat competitive analysis as a signal stack, not a single dataset:
Syndicated data (for market share, distribution, velocity proxies where available)
Retail/e-commerce shelf pricing (visible price)
Transactional pricing proxies (in-cart, coupon, bundle mechanics)
DTC stores and marketplaces (where competitors can move without retailer friction)
Assortment and availability (stock-outs change competitive dynamics fast)
Internal transaction data (net price realization, pocket price waterfall, promo funding)
Distribution signals (where share moves are actually distribution moves)
Your data stack will differ by industry, but the main idea is the same: competitive analysis gets better when you stop expecting one source to cover everything.
Building a competitive analysis capability that holds up in the real world
Step 1: Align on “who counts as a competitor” before you model anything
This step may not be exciting, but it prevents months of rework.
A practical approach:
Start with a broad list: global category competitors, plus channel-specific and DTC entrants.
Agree on a “core set” for decisioning (the competitors that truly move your volume or bids).
Document why they’re included: share, substitutability, channel overlap, tender overlap, etc.
Review quarterly with local teams, not as a formality, but as a governance step.
For global organizations, this is where you prevent the “global vs. local” fight from becoming the default.
Step 2: Fix product matching with a repeatable “normalization” layer
If product matching is weak, every result is open to debate.
What works:
Normalization rules based on how customers actually compare value:
consumer goods: unit price, price per ounce/ml, price per serving, “equivalent pack”
durables: price per capacity band, price per feature tier
pharma: price per defined daily dose (or a dose-normalized unit), and pack normalization
A competitor mapping table that is maintained, updated, and managed, rather than a one-time spreadsheet
Exception handling: what happens when a competitor changes pack architecture, launches a new SKU, or introduces a bundle
For the global pharma company example, “apples-to-apples” required normalizing by daily dose rather than tablets. The output changed from “we’re priced high” to “we’re priced competitively for the dose,” which materially affected how local teams viewed pricing headroom.
Step 3: Capture the “true” price, not just the visible one
In 2026, competitive pricing tactics are often designed to avoid detection: coupons, in-cart discounts, membership pricing, targeted offers.
If your competitive analysis doesn’t capture these, your CPI is wrong.
For the consumer electronics company, the gap was real: competitors used discounts that did not show on the product page, so teams had to take manual screenshots as proof for internal stakeholders. This signals a broken process. Your competitive analysis should record:
visible price
discount mechanics (coupon, in-cart, bundle)
the effective price after the discount
timestamps (price position changes quickly)
channel (Amazon vs DTC vs big-box retailer site)
Step 4: Compute CPI in a way that supports decisions
CPI is helpful only if it is used consistently and connected to outcomes.
A practical setup:
Calculate CPI at the level people actually manage:
key item x retailer x region x week (or day for fast-moving categories)
Maintain CPI corridors by segment:
Example: a corridor like 0.95–1.05 versus a primary competitor for a “parity” segment
A wider corridor for a premium segment where value differentiation holds
In concentrated categories such as consumer electronics, your price position compared to competitors matters more than the size of discounts. If both companies lower their prices simultaneously, the impact on market share may be minimal. If only one lowers prices, volume can shift quickly. CPI corridors help turn this idea into a clear rule.
Step 5: Add cross-elasticity where it matters, not everywhere
Cross-price elasticity answers the question: “If competitor price moves, what happens to my volume?”
The mistake is trying to model everything for every SKU immediately. A better approach:
Focus on the SKUs (or segments) that account for most revenue and most competitor exposure
Model at the level where you have enough signal:
product group x retailer x region is often more stable than SKU-level in early phases
Revisit the models on a set cadence (quarterly is common)
This is how competitive analysis shifts from just monitoring to actually supporting decisions.
Step 6: Embed competitive signals into two workflows
This is what separates unused tools from those that make a real impact.
Workflow A: Due-to analysis (diagnostic)
When performance dips, the question is “why,” not “what.”
For the beverage company, the key need was speed: they had data, but it took hours to isolate whether the dip was a competitor promo in a specific account or a distribution change. Competitive analysis needs to sit inside the diagnostic workflow:
“We’re down 2.1% in the Midwest”
Break the change into:
distribution change
price change (net price realization)
promo depth/frequency
competitor price position and competitor distribution
Workflow B: Scenario analysis (forward-looking)
Pricing decisions focus on the coming weeks and the next quarter, rather than what happened in the previous quarter.
Competitive analysis should feed scenarios such as:
“If we take +2% list in Q2 and the main competitor holds, what’s the likely volume impact?”
“If we hold price and the competitor runs a 15% off promo for two weeks, what’s the expected hit?”
“If we add a missing pack size, do we reclaim distribution, or just cannibalize?”
A simple scenario example you can use in a pricing meeting
Here is an intentionally simple example that shows why competitor response matters.
Assume:
Current price = $100
Current volume = 10,000 units
Unit cost = $70 (so gross margin is $30/unit)
Baseline:
Revenue = $100 × 10,000 = $1,000,000
Gross profit = $30 × 10,000 = $300,000
Scenario: +2% price increase
New price = $102
Assume own-price elasticity = −1.2
Expected volume change = −1.2 × 2% = −2.4%
New volume = 10,000 × (1 − 0.024) = 9,760 units
New results:
Revenue = $102 × 9,760 = $995,520
Unit gross margin = $102 − $70 = $32
Gross profit = $32 × 9,760 = $312,320
In this simple example, revenue remains about the same, but gross profit increases by $12,320.
Now consider how a competitor might respond. If you expect the main competitor to follow your price move, or if cross-elasticity shows they usually do, your volume loss may be smaller. If they do not follow, the loss could be bigger. Competitive analysis helps you make informed decisions instead of guessing.
White space: competitive analysis that isn’t about price matching
Competitive analysis shouldn’t only answer the question, “Are we cheaper or more expensive?”
It should also reveal:
segments where competitors are absent
pack sizes/features that are missing from your portfolio
price bands that are underserved
channel gaps (competitors strong in DTC while you’re retailer-dependent, or vice versa)
Both the global pharma and consumer examples demonstrate that the most valuable insights often arise from identifying portfolio gaps and distribution voids, rather than simply knowing who had the lowest price on a given day.
Common objections and pragmatic answers
Objection 1: “We already have syndicated data. This will be redundant.”
This came up directly with the beverage company. The right response is not “buy more data.” The right response is: use the existing data differently.
Syndicated portals often help with:
share trends
distribution
broad pricing averages
They often do not provide:
fast diagnostics across geo x account x product in one view
visibility into in-cart pricing, coupons, DTC stores
decision workflows tied to scenario analysis
The goal is not to repeat share charts, but to reduce the time it takes to get answers and connect competitor signals to real decisions.
Objection 2: “Competitive analysis will just push us into a price war.”
It can, if it’s used poorly.
The fix is governance:
CPI corridors by segment
escalation rules (when do we respond vs hold?)
clear ownership: pricing sets guardrails; sales executes within them; finance validates P&L impact
Competitive analysis should help prevent panic discounting, not exacerbate it.
Objection 3: “Our products aren’t comparable. Apples-to-apples is impossible.”
Comparability is rarely perfect, but that is not a reason to stop trying.
The right approach is:
define the normalization logic (dose, unit price, capacity bands)
make exceptions explicit
version-control the mapping and treat it like a commercial asset
If you don’t do this, local teams will continue to reject the analysis, and you’ll never build confidence in price actions.
Objection 4: “This will become a giant IT project.”
Only if you try to do everything at once.
Start with:
a narrow scope (top competitors, top SKUs, top channels)
a weekly cadence
a usable dashboard with drill-down and audit trails
Then expand from there. Initially, focus on building credibility and repeatability, rather than perfection.
Industry micro-scenarios (with numbers)
1) Manufacturing: two-player category and CPI discipline
A concentrated hardware category behaves differently from fragmented CPG.
If your category is essentially comprised of two major competitors and fringe players, the commercial reality is that relative price position serves as a steering wheel. A practical operating rule might be:
Maintain a CPI between 0.95 and 1.05 compared to the primary rival for parity products.
Allow a wider band for premium tiers where value differences are defensible.
In 2026, the channel mix changes: DTC competitor stores and marketplaces can adjust prices quickly and quietly, including in-cart discounts. If your CPI only uses visible prices, you might think you are at 1.00, but you may actually be at 1.08 at checkout. This kind of gap can shift volume when products are substitutes.
2) Distribution/CPG: “Why are we down?” in under 15 minutes
A beverage brand experiences a 3% decline in velocity in a region two weeks after implementing a price increase.
The bad version of competitive analysis:
“We increased price, demand dropped.”
The response is discounting to recover volume.
The decision-grade version:
Decompose the decline:
1.5% from lost distribution in a key retailer
1.0% from the competitor gaining distribution
0.5% from competitor promo depth
0.0% attributable to the price increase (after controlling for distribution shift)
This changes what you do next. Instead of cutting prices, Sales can focus on recovering distribution and adjusting promo timing.
The challenge with disconnected systems and data for competitive pricing analytics in CPG.
3) Retail: price changes at shelf-speed
Retailers adopting electronic shelf labels can change prices frequently across thousands of items, and some have reported the ability to change prices up to 100 times a day. (The Wall Street Journal)
For a brand selling through retail, this means:
competitor prices can move while your weekly report is still being produced
your own promo compliance becomes part of competitive analysis (did the promo land at shelf as planned?)
Retail competitive analysis in 2026 must include:
shelf price
promo execution/compliance
availability (stock-outs rewire the competitive set quickly)
Implementation notes for a 2026 launch
Onboarding and data health check
Start by assessing:
internal transaction data quality (net price realization, promo funding, customer mapping)
product hierarchy (do you have stable identifiers across systems?)
competitive sources and coverage gaps (DTC, marketplaces, in-cart pricing)
Configuration
Define the competitive set and the matching rules.
Define CPI corridors by segment and channel.
Define refresh frequency:
daily for e-commerce-exposed categories
weekly may be sufficient in slower B2B segments, but only if your competitors also move slowly
A practical review schedule might look like this:
A cadence that works in practice:
Weekly 30-minute competitive review: CPI exceptions, promo changes, distribution shifts
Monthly deep-dive: elasticity updates, scenario refreshes, white space scan
Quarterly governance: competitor set review with local teams
Training
If the analysis is going to change decisions, you need training that mirrors real workflows:
how to interpret CPI and exceptions
how to run a scenario and explain it to a GM
how to avoid reacting to competitors with instinctive price matching
Where Revology fits
Revology’s work typically sits at the intersection of pricing decisions, analytics, and execution. On the pricing and revenue growth management side, Revology describes outcomes reported by clients, including operating profit improvements up to 10%, gross profit improvements up to 15%, and promotional ROI improvements up to 50%.
For competitive analysis specifically, the work tends to fall into two tracks:
Pricing & RGM advisory:CPI design, price corridors, discount governance, price waterfall and profit leakage work, and decision workflows.
Commercial analytics transformation:building the underlying data model and the dashboards so teams can answer “why” questions quickly and repeatably.
If you want a concrete starting point, begin with a diagnostic that examines your competitive price position and identifies key blind spots in your category, such as in-cart discounts, DTC coverage, product matching, or the speed of your due-to analysis.
Who this is for
Pricing and RGM leaders who need competitive analysis to support price actions and scenario decisions
Sales leaders who want clearer guidance on when to hold price vs respond
Commercial finance teams who need faster “what changed?” explanations
Who this is not for
Teams looking for a monthly competitor newsletter with no linkage to decisions
Organizations unwilling to define governance (competitive set, match rules, decision rights)
If competitive analysis still feels rushed before major meetings, consider requesting a competitive pricing position diagnostic. You will gain a clear view of your CPI by segment, identify your main blind spots (such as DTC, in-cart pricing, or matching), and receive a practical plan to address them.
Subscribe to
Revology Analytics Insider
Revenue Growth Analytics thought leadership by Revology?
Use the form below to subscribe to our newsletter.
