
Pricing Increase: A Brief Implementation Guide for Strategy, Messaging, and KPIs
Learn how to design, communicate, and implement a pricing increase that expands margin while minimizing avoidable churn. This guide includes segmentation frameworks, practical examples, and measurement plans.
A pricing increase is a deliberate adjustment to list price, net price, fees, or packaging and terms that raises what customers pay for the same or enhanced value. It is managed through price architecture and enforced by governance to ensure realized price increases align with intended changes. To minimize churn, segment customers by willingness to pay and risk, tailor value-based messaging by segment, and measure price realization and retention weekly to enable rapid course correction.
Price increases are common, but most do not achieve their intended margin gains. Applying a uniform percentage often leads to increased discount exceptions, higher churn in valuable segments, and lower net price realization. Recurly’s 2024 subscription research, covering over 1,200 businesses, found that 71% of customers cite price increases as the main reason for cancellation. However, companies using segmented pricing and proactive communication achieve renewal rates above 95%.
The primary challenge is disciplined execution. A pricing increase affects customer perception, sales compensation, contract renewals, and operational systems. This guide explains how to design, communicate, measure, and govern a pricing increase, from foundational principles to implementation.
What a Pricing Increase Is (and Key Terminology)
A pricing increase is any upward adjustment to what you charge customers. The complexity comes from which price you’re adjusting. List price is the published catalog price. Net price is what the customer pays after volume discounts, rebates, and negotiated concessions. Realized price (pocket price) is the net price minus post-invoice deductions such as co-op advertising, freight allowances, and early payment discounts.
A common pitfall is raising list price by 5% but seeing realized price improve by only 2% or even decline if discounting behavior changes. In distribution and manufacturing, the gap between list and realized price often ranges from 15 to 30 percentage points. This gap frequently undermines price increases.
Common forms include one-time adjustments (discrete percentage changes at a specific date), phased or step-up approaches (tranches over time), and index-linked pricing tied to benchmarks such as CPI or PPI. The Bureau of Labor Statistics reported CPI growth of 2.7% year-over-year through December 2025, with PPI for finished goods rising 3.7%. Many B2B companies saw input cost inflation outpace pricing actions by 400–800 basis points during 2022–2024, creating an ‘inflation gap’ that requires surgical correction.
Why Pricing Increases Matter (Beyond “Covering Costs”)
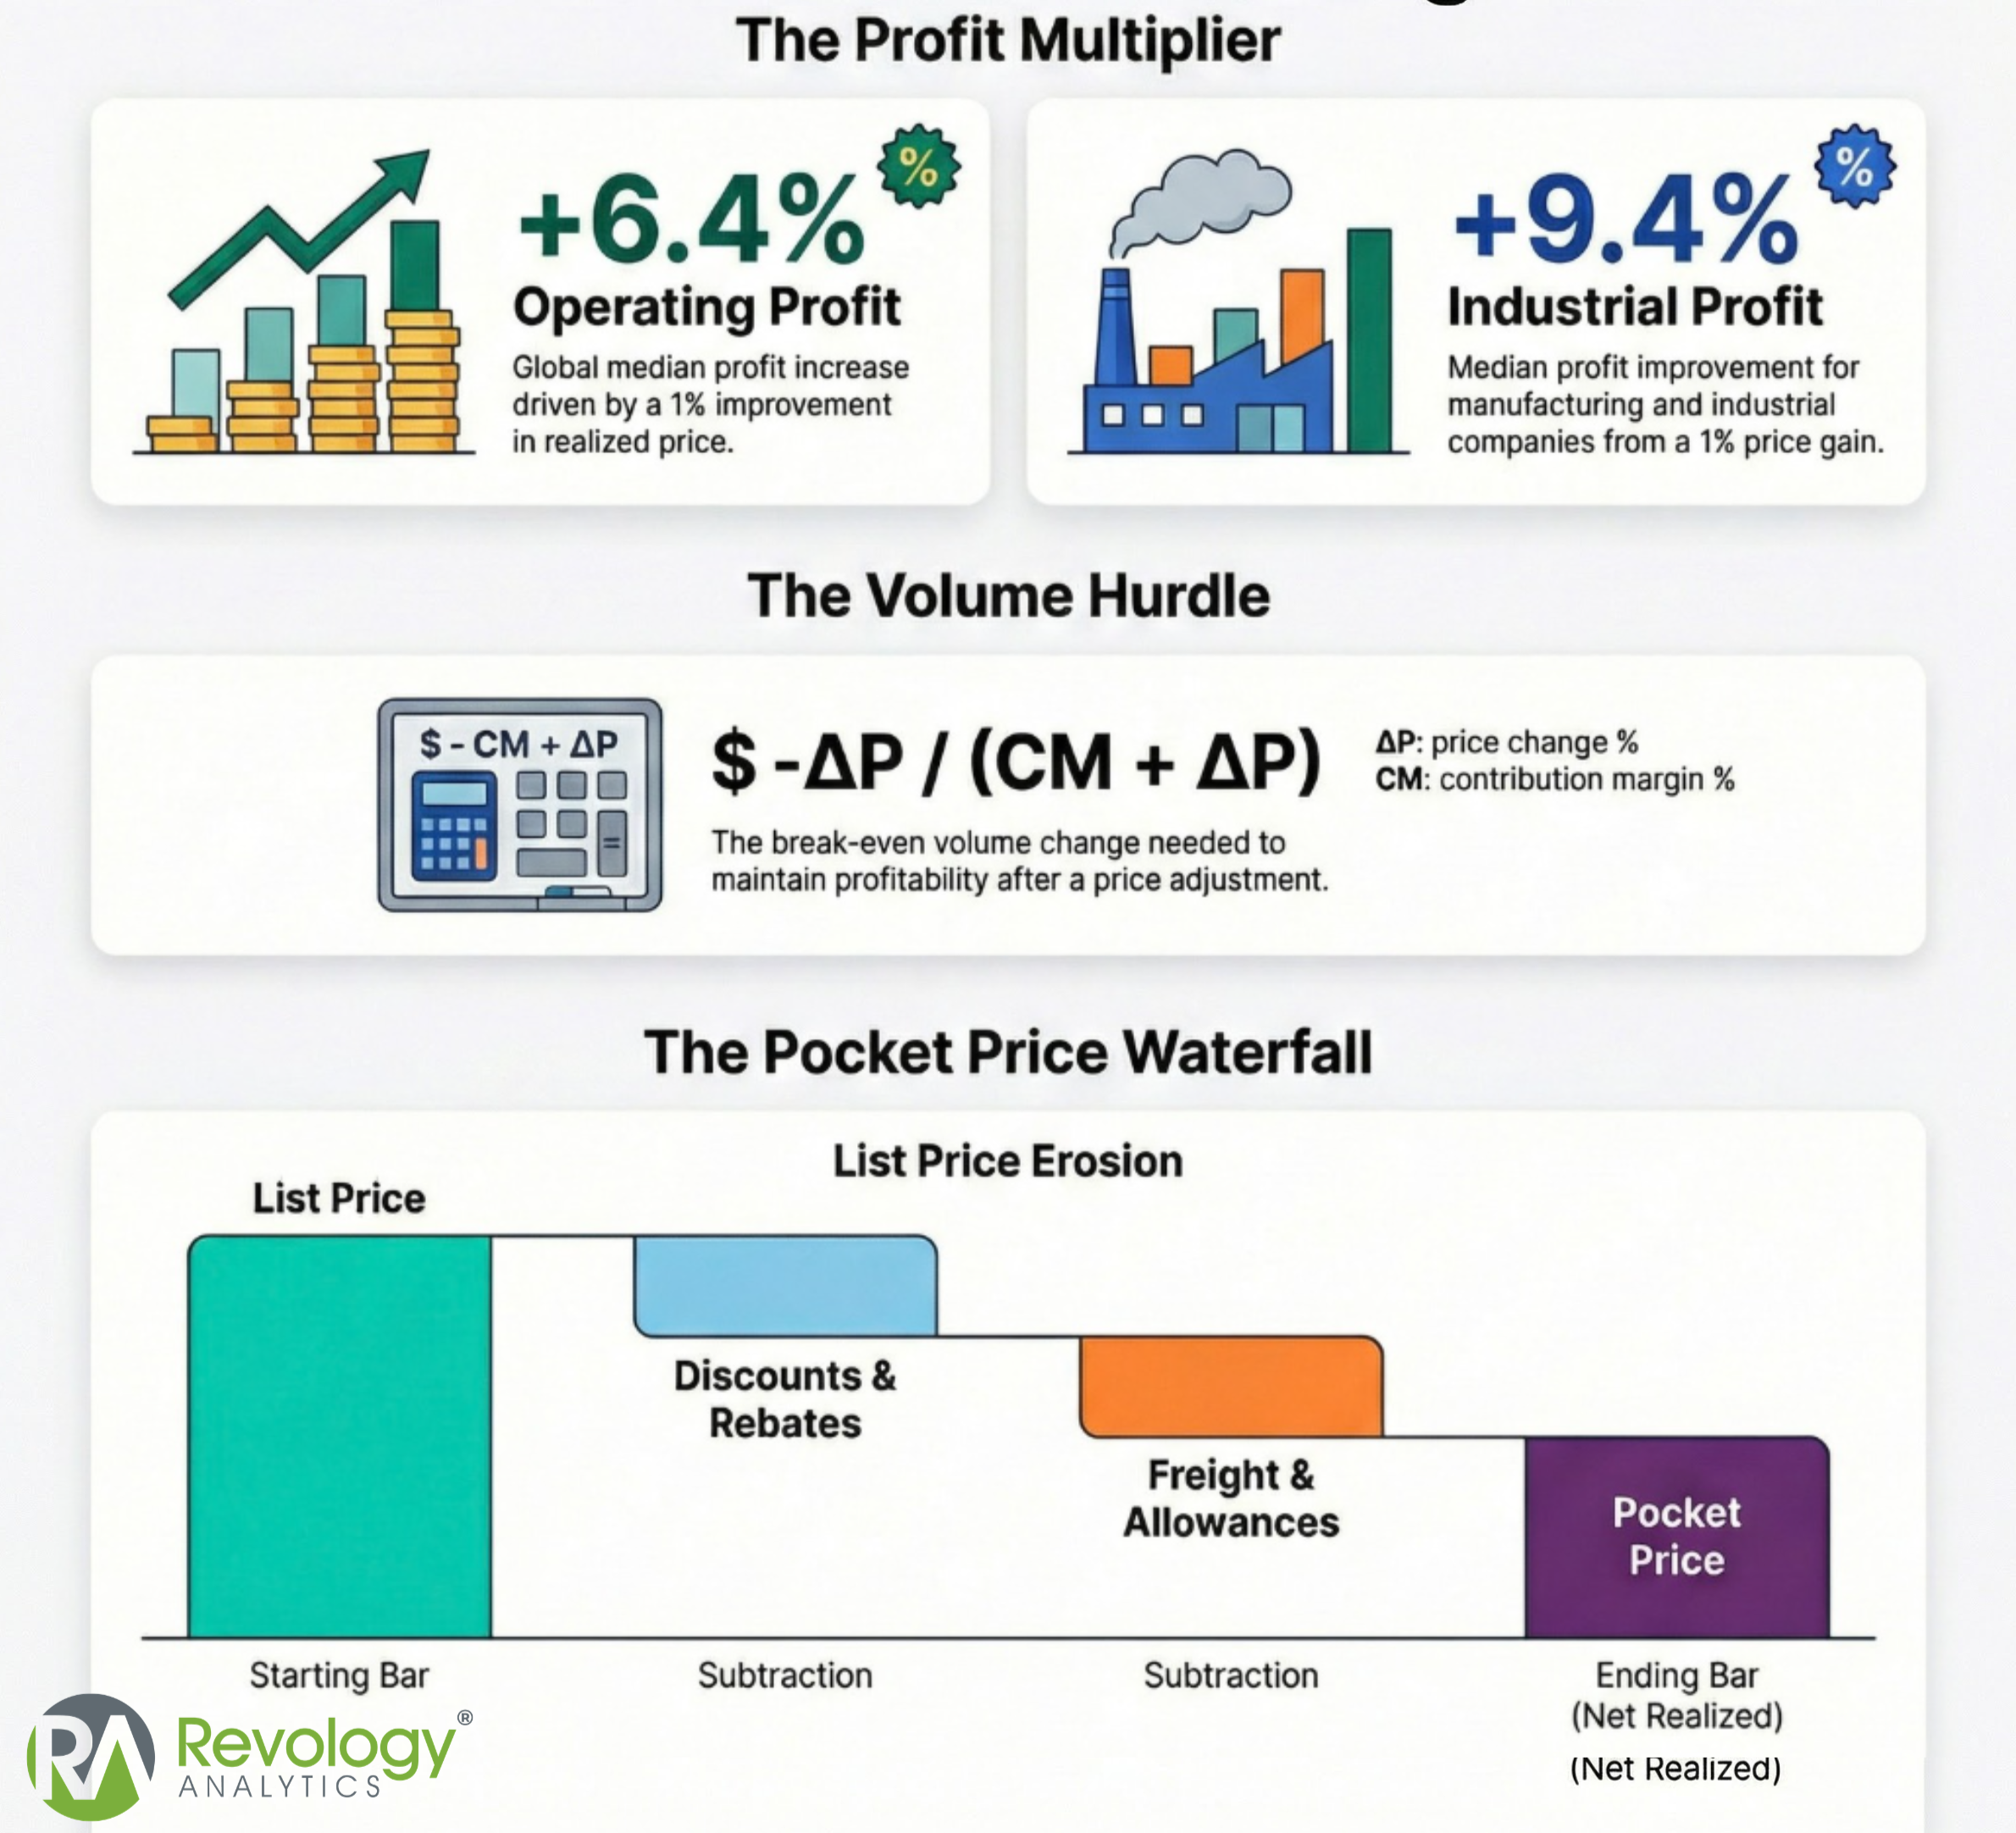
Pricing carries disproportionate P&L leverage. Revology’s June 2025 study, ‘Pricing Still Packs a Punch,’ analyzing roughly 2,000 public companies, found that a 1% improvement in realized price drives a median 6.4% increase in operating profit, with the interquartile range spanning 3.3% to 14.3%. No other lever delivers that kind of bottom-line multiplier. That sensitivity cuts both ways: a 2% realized price decline can eliminate the benefit of a 10% headcount reduction in many operating models. For companies running 8–12% EBITDA margins—most mid-market manufacturers and distributors—the math is unforgiving. Beyond margin, holding price flat while competitors raise theirs repositions you as the budget option, whether you intend it or not. Learn more about taking pricing to the next level to understand why pricing discipline compounds over time.
Price increases and decreases also have non-symmetrical effects on profit—a fact many leaders underestimate. A retailer with 50% contribution margins that cuts prices by 15% needs 43% volume growth just to break even on the decision. That same retailer raising prices by 15% remains more profitable unless volume drops by more than 23%. The math sharpens at thinner margins: a manufacturer with a 25% contribution margin who takes a 5% price cut must grow volume by 25% to recover the lost profit dollars, while a 5% price increase stays profitable unless volume falls by more than 14%. This asymmetry is why volume hurdle analysis should precede every pricing action—the break-even threshold for a price cut is almost always steeper than leaders assume.
When to Consider a Pricing Increase (Decision Triggers)
Cost pressure is a primary trigger. When input costs, freight, labor, or compliance expenses rise faster than pricing, margins compress. Demand signals are equally important: capacity constraints, backorders, and allocation scenarios indicate pricing power. Operating at over 95% utilization suggests an opportunity to increase price.
Value delivered is the clearest trigger. Product improvements, service enhancements, faster delivery, and digital tools justify price adjustments. Competitive benchmarking is also important: if your price-to-market ratio is 10 to 15 points below competitors without clear differentiation, you are likely under-priced. Contract renewal cycles, such as annual renewals and multi-year expirations, provide natural opportunities to reset pricing. For more on common pricing and revenue growth management pain points that indicate a need for a pricing increase, refer to our diagnostic framework.
The 5 C’s of Pricing—Applied to a Price Increase Decision
The 5 C’s—Costs, Customers, Competition, Company objectives, and Channels—offer a structured approach. Costs set the minimum: if variable costs rise 8% on 12% gross margins, holding price flat erodes margin. Customers set the maximum through willingness to pay, which varies by segment. Competition defines the price corridor; if competitors increase prices by 6 to 8% and you do not, you create an unintended discount. Company objectives guide priorities, such as margin expansion or share defense. Channels add complexity: a price increase in direct B2B may be absorbed by distributors before reaching end customers. Balancing profit and customer satisfaction is essential for effective channel-specific pricing.
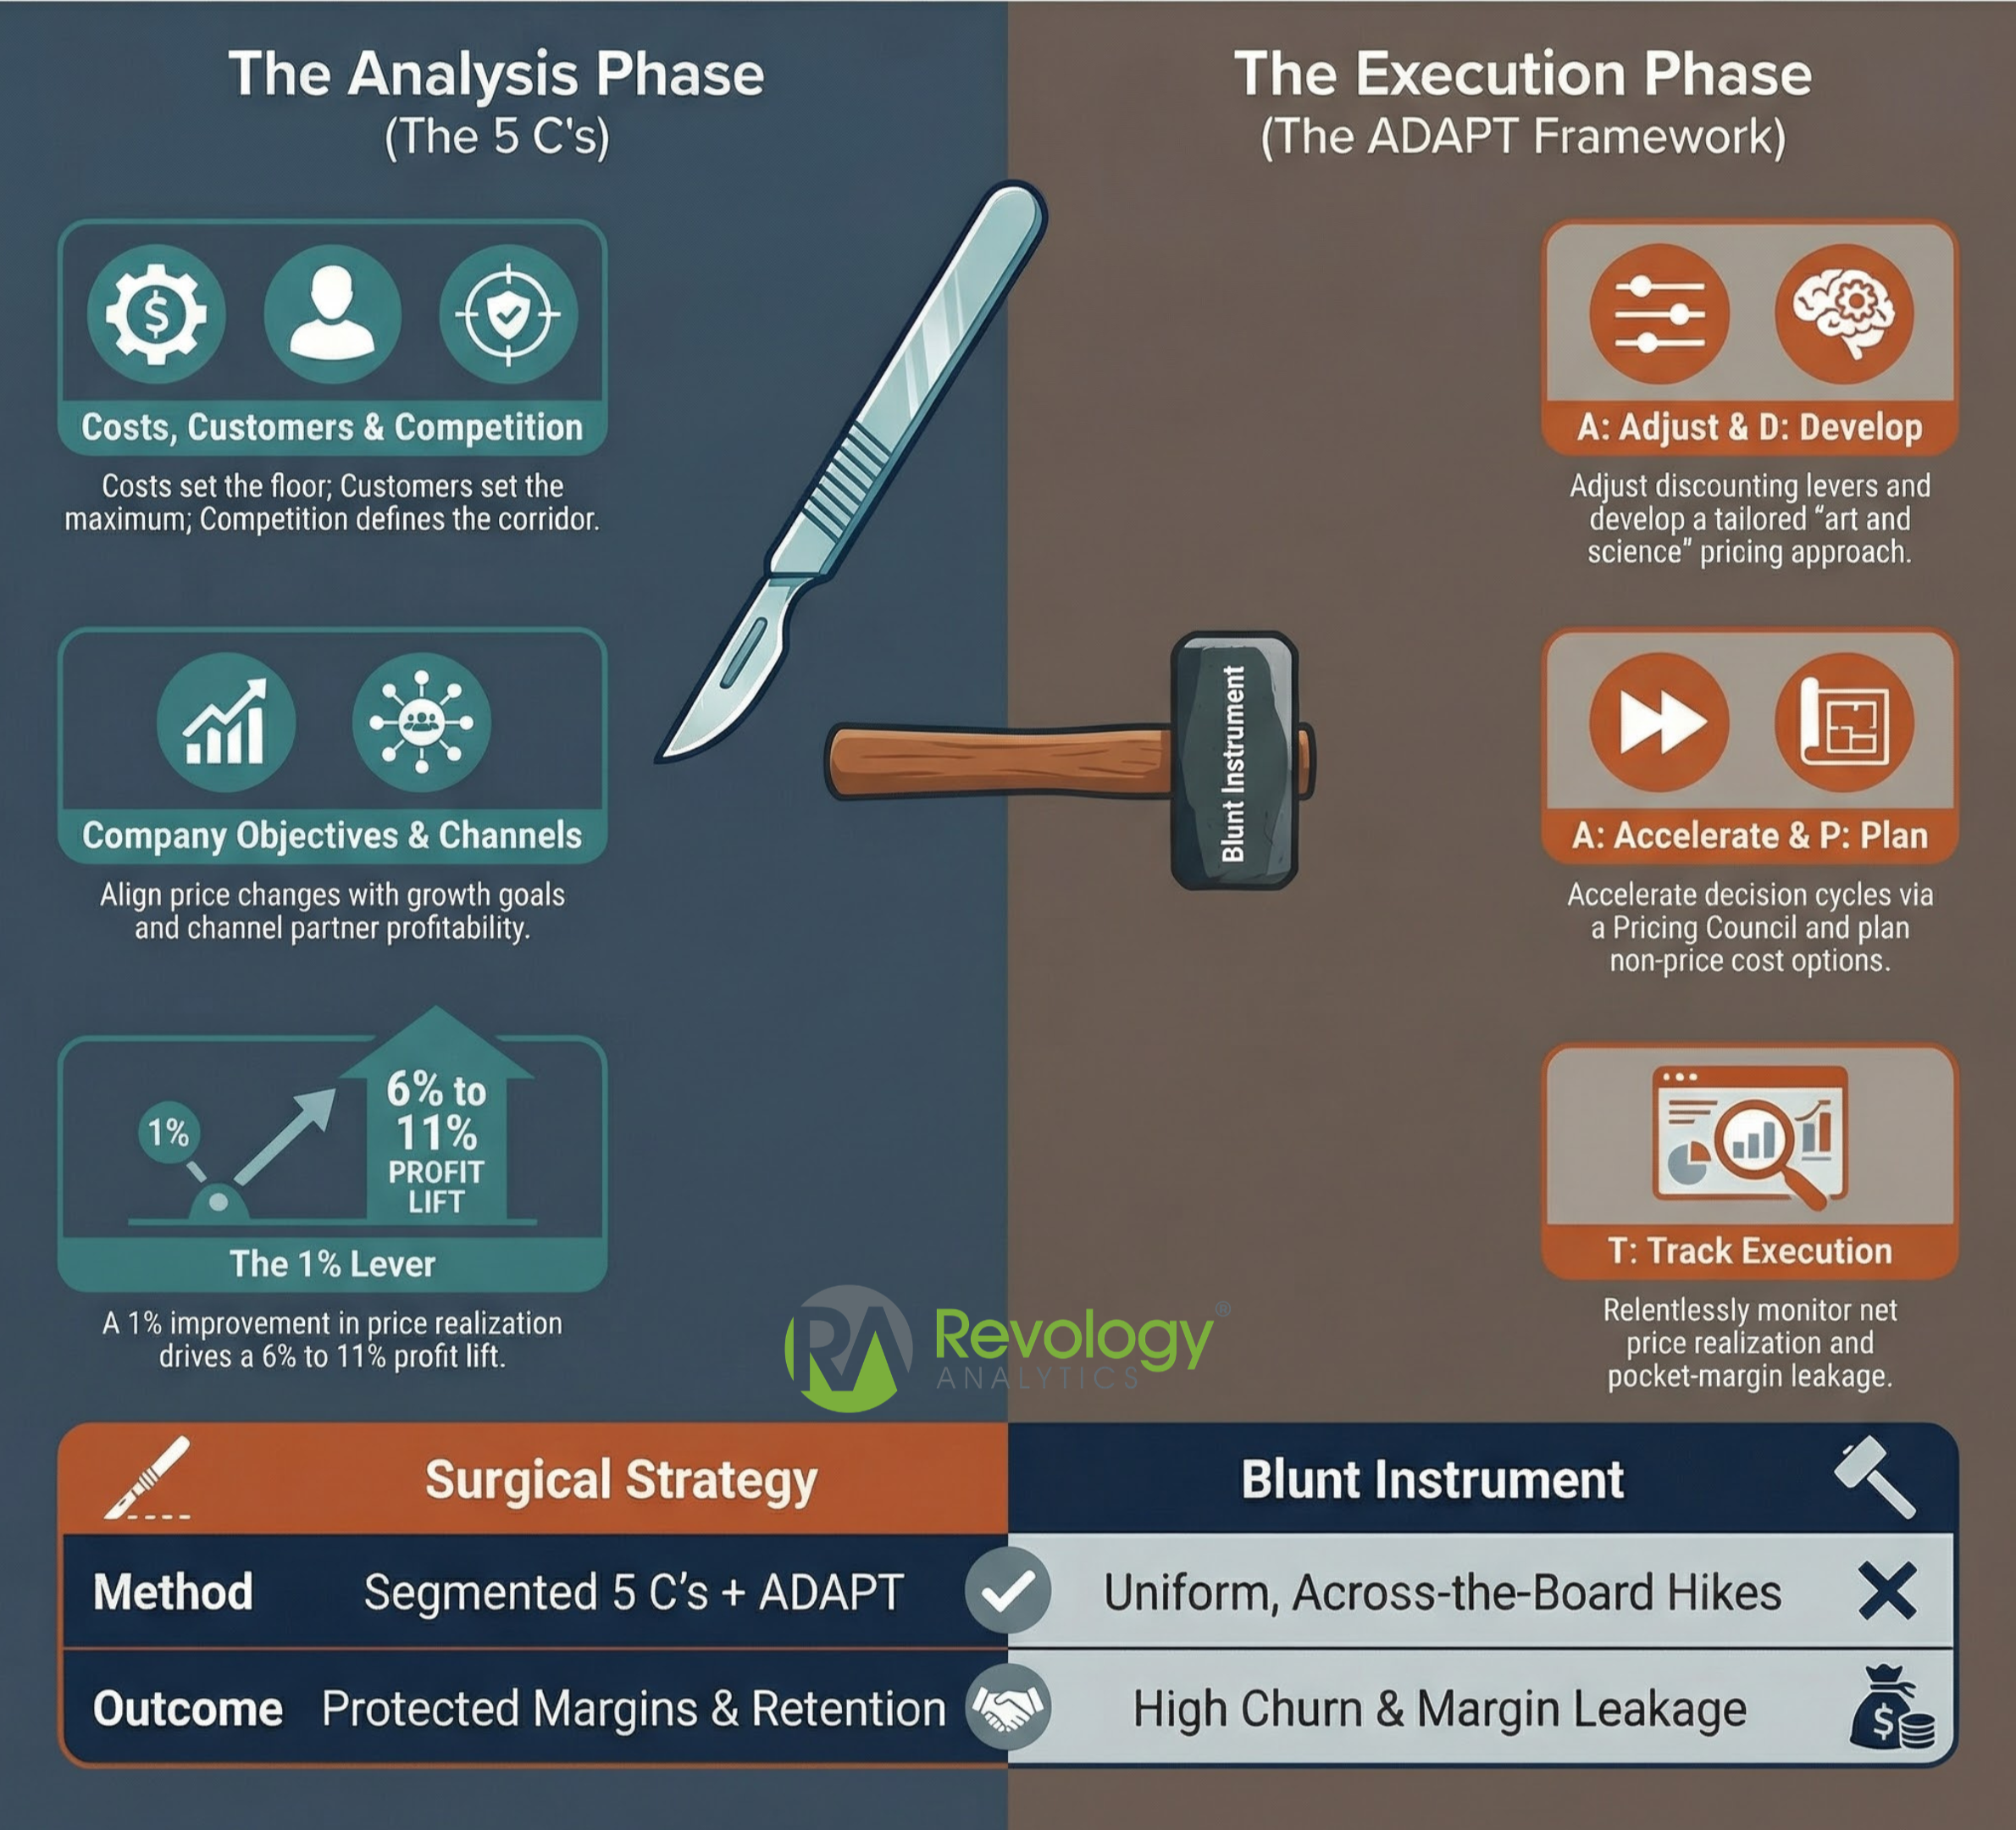
surgical pricing, beyond the blunt instrument
A Practical Framework to Design the Pricing Increase
Step 1: Segment customers by churn risk and value. Divide your customer base into cohorts. High-value, low-risk customers can absorb larger increases, while high-risk, lower-value customers may require smaller increases or alternative offers. A simple 3×3 matrix can be used: Segment A (Defend & Grow), Segment B (Optimize & Hold), Segment C (Selective Increase or Prune). Effective segmentation relies on transaction data (24 to 36 months of invoices, discounts, rebates), customer data (tenure, usage, support load), product data (cost-to-serve, feature usage), and competitive benchmarks.
Step 2: Select the increase structure. Flat percentage increases are the simplest but least precise. More effective methods include tiered pricing by volume, step-up clauses, contract extensions to lock in current pricing, or reconfiguring offers. Optimizing pack architecture by adjusting per-unit pricing across configurations often yields greater margin than blanket increases.
Step 3: Establish price fences and an exceptions policy. Specify approval authority for discount variances, require business justification, and publish a weekly exception report during the first 90 days.
Step 4: Align sales compensation and deal desk rules. If compensation plans reward revenue regardless of price, representatives may discount to maintain volume. Introducing a margin or price realization modifier, even at 10 to 15% weighting, can change behavior. Explore pricing and revenue growth management strategies that link incentives to price realization.
How to Calculate and Model a Pricing Increase
Start with baseline price realization. For each segment, calculate the average list price, net price, and realized price per unit. The realization rate is the Realized Price divided by the List Price. Many distributors run 60–85% realization rates—that 15–40 point gap is where increases succeed or fail.
Next, estimate volume elasticity by segment—but recognize that the simple formula Price Elasticity = (% Change in Quantity) ÷ (% Change in Price) produces biased results in real commercial settings. This ratio works only when price changes occur in isolation, which never happens. In practice, price moves alongside promotions, competitive shifts, seasonality, and distribution changes. Attributing volume changes solely to price without controlling for these confounders produces estimates that are systematically wrong—sometimes by 200–300 basis points.
The mathematics of pricing increase
The core problem is omitted variable bias. When you run a simple regression of volume on price, the resulting coefficient conflates the true price effect with everything else moving at the same time. A manufacturer raises prices by 5% in Q4 while simultaneously cutting promotional spend by 20%—a simple analysis credits the volume drop entirely to price sensitivity, when most of it came from reduced trade support. The opposite error occurs just as often: price increases coincide with competitor stockouts or new product launches, masking true elasticity by attributing competitor-driven volume gains to low price sensitivity.
Three robust approaches address this:
Log-log regression with controls. Instead of using percentage changes directly, estimate elasticity using log-transformed variables in a regression framework: ln(Volume) = β₀ + β₁ × ln(Price) + β₂ × ln(Competitor Price) + β₃ × Marketing + β₄ × Seasonality + ε. The coefficient β₁ is your elasticity estimate, and because it's estimated jointly with control variables, it isolates price effects from correlated drivers. This approach works well when you have cross-sectional variation (multiple products or customers) and can specify the right controls. The limitation is linearity—log-log models assume elasticity is constant across the entire price range, but this assumption breaks down at extreme price points.
Panel data methods with fixed effects. If you have repeated observations over time (monthly sales by product-region, for example), use panel regression with entity fixed effects. This approach differentiates out all time-invariant factors—brand equity, distribution strength, product quality—that correlate with both price and volume. The model becomes: Volume_it = β₁ × Price_it + α_i + γ_t + ε_it, where α_i captures product-specific effects and γ_t controls for time shocks affecting all products. Fixed effects estimation is particularly valuable when you suspect unobserved quality differences or regional factors are biasing naive estimates. The cost is reduced sample variation—you're estimating elasticity only from within-entity price changes over time.
Double Machine Learning (DML) for causal isolation. When confounders are numerous and exhibit complex non-linear relationships with price and volume, DML provides a three-stage framework that neutralizes bias without requiring you to specify functional forms. Stage 1 uses machine learning (Ridge regression, random forests) to predict volume and price separately using all available controls—marketing spend, competitor actions, distribution metrics, and seasonality. Stage 2 extracts residuals by subtracting these predictions from actual values, isolating the variation in price and volume that remains unexplained by confounders. Stage 3 regresses volume residuals on price residuals to estimate the clean causal effect. Revology uses DML to analyze retail pricing in highly promotional categories, where simple controls fail to capture the interactions among pricing, trade spending, competitive intensity, and category growth. The method is computationally intensive but produces elasticity estimates robust to model misspecification—critical when promotional mechanics and competitive dynamics shift quarter to quarter.
Regardless of method, validate estimates against commercial intuition. Products with elasticity between 0 and -1.0 are inelastic—revenue and margin both improve with increases. Large integrated accounts often exhibit elasticities of -0.2 to -0.5 due to switching costs and contract lock-in. Small transactional buyers may exhibit an elasticity of -0.8 to -1.5 when alternatives are readily available. If your model produces elasticities outside the range -2.0 to 0, either your data has severe quality issues or your method is capturing spurious variation rather than the true price response. Segment-level heterogeneity is real—a global median elasticity of -0.8 can easily mask a range from -0.3 (strategic accounts) to -1.4 (spot buyers)—but implausible estimates are a signal to revisit your data or method, not to proceed with flawed assumptions.
Price Elasticity = (% Change in Quantity) ÷ (% Change in Price)
Products with elasticity between 0 and -1.0 are inelastic—revenue and margin both improve with increases. Large integrated accounts often exhibit elasticities of -0.2 to -0.5 due to switching costs. Small transactional buyers may show -0.8 to -1.5.
Then model the blended outcome using segmented increase percentages weighted by revenue share. Key formulas:
Net Price = List Price − discounts − rebates + surcharges ± terms effects
Volume Hurdle (Break-Even Volume Change) = –(%∆P) ÷ (%CM + %∆P), where %CM is the initial contribution margin as a percentage of price, and %∆P is the price change percentage.
Expected Volume Change = Price Elasticity × %∆P (this must exceed the volume hurdle to drive incremental gross profit)
Gross Margin Impact = (ΔPrice × Volume) − (ΔCost × Volume) − concessions
Contribution margins drive the size of the volume hurdle—larger margins lead to smaller hurdles, and vice versa. A retailer with a 50% contribution margin can absorb a 15% price increase and remain profitable, provided volume does not drop by more than 23%. A manufacturer with a 25% contribution margin takes a 5% increase and stays ahead unless volume falls more than 14%. A distributor running 1% contribution margins faces a razor-thin tolerance: a 10-basis-point price increase goes underwater if volume declines by more than 9.1%. These thresholds should be the first line of analysis before any pricing action proceeds, and the volume hurdle formula above can be calculated using internal records for the current price and variable costs. One important caveat: fixed costs are irrelevant for marginal price change decisions. Fixed costs determine whether to enter, stay in, or exit a market—they should not influence the pricing action itself.
Conduct sensitivity analysis using pessimistic, baseline, and optimistic scenarios. Determine the realization rate or elasticity at which the price increase becomes margin-negative.
KPIs to Track Before, During, and After the Increase
Price realization rate is the primary metric: what percentage of the list price increase resulted in realized price improvement? Calculate it as (Change in Realized Price) ÷ (Change in List Price) × 100. Track this weekly by segment and representative during the first 90 days, and flag any result below 75%.
Customer outcomes: Separate volume losses into churn (customers lost entirely), downsell (reduced volume), and mix shift (trading down to lower-priced SKUs). Each has different margin implications.
Commercial outcomes: Win rate, sales cycle length, and renewal uplift. Revology’s study found that a 1% realized price gain drives a median 6.4% improvement in operating profit—use this to calibrate expectations.
Operational outcomes include exception rate (the percentage of transactions requiring discount exceptions) and approval cycle time. If 30% of deals require exceptions, guardrails are ineffective. Approval workflows should be completed within 24 hours.
Customer Communication Strategy for a Pricing Increase
Customer messaging should address three questions: Why is the price changing? What value am I receiving? What are my options? Begin with market context, then highlight specific value improvements such as faster delivery, enhanced service, or product upgrades. Avoid generic inflation justifications.
Message architecture: Context ('Our industry has seen X% cost inflation') → Value ('We have invested in specific improvements') → Action ('Effective [date], pricing increases [X]%') → Partnership ('We are available to help optimize your total cost'). Announce 60 to 90 days before the effective date for contractual customers, and 30 to 45 days for transactional customers.
Match the delivery channel to the depth of the customer relationship. Strategic accounts should receive in-person meetings. Mid-tier accounts should receive personalized emails with follow-up calls. Transactional accounts can be notified with templated messages and FAQ links.
Sales teams need talking points, objection responses, and clear approval authority before customer notifications. Conduct role-playing sessions, as the first 20 conversations after the announcement set the tone. If representatives sound apologetic or offer concessions immediately, customers are more likely to push back.
Worked Example: B2B Subscription Price Increase
A B2B SaaS company with 1,200 customers, $240 average ARPU, and 70% gross margin segments its base:
Segment A (Enterprise): 200 customers, $750 ARPU, 3% churn, 75% margin → +8% increase, no concessions
Segment B (Mid-Market): 500 customers, $300 ARPU, 7% churn, 72% margin → +5% increase with lock-in option
Segment C (SMB): 500 customers, $120 ARPU, 15% churn, 65% margin → +2% increase, prune inactive accounts.
Baseline revenue: $360,000. After modeling elasticity by segment (-0.25 for A, -0.60 for B, -1.00 for C), revenue dips 3.8%, but contribution margin falls only 0.6%—the company sheds low-margin SMB volume while retaining high-margin enterprise accounts. Revising Segment B with enhanced retention tactics (12-month lock-in plus a bundled premium feature) improves elasticity from -0.60 to -0.45, recovering $3,465 in revenue and achieving +0.8% contribution margin expansion despite 2.8% revenue contraction. The company sets an 85% realization target and establishes weekly KPI dashboards by segment.
Common Pitfalls (and How to Avoid Them)
Uniform increases overlook differences in willingness to pay. A 7% blanket increase under-prices loyal accounts, who could absorb 10 to 12%, and over-prices transactional buyers, who may churn at 7%. Announcing without sales enablement leaves representatives unprepared, and the first mishandled customer call can set a precedent for concessions. Without governance or exception tracking, discounting becomes unchecked, and customers may threaten churn, knowing representatives will concede.
Inadequate measurement of price realization can lead to overestimating margin gains. For example, a 6% list increase may result in only a 2.5% realized price improvement if promotional spending doubles. Poor timing, such as announcing mid-year with only two weeks’ notice, creates confusion. Align announcements with customer budget cycles, such as announcing in Q4 for January 1 implementation. Overusing grandfathering creates permanent price gaps that widen over time; instead, use structured step-ups or time-limited lock-ins.
In addition to tactical errors, consider the strategic limitations of volume hurdle analysis. Volume hurdles do not account for long-term changes in customer demand caused by price changes. For example, a temporary price reduction can reset reference price expectations, making it difficult to restore previous prices after a promotion. Competitor reactions may also affect projected volume changes. In some cases, it may be appropriate to forgo a pricing action even if the volume hurdle is met, or to proceed despite not meeting it, to avoid price wars or market share loss. Volume hurdles are an important initial check, but not the sole consideration in pricing decisions.
Implementation Roadmap (30–90 Days)
Days 1–30: Pull 24 months of transaction data, segment customers by churn risk and value, model elasticity, run scenario analysis, design segmented pricing with fences, build governance framework (approval matrix, exception workflow), draft communication templates, and enablement materials.
Days 31–60: Train the sales team with role-playing exercises. Announce to strategic accounts via meetings, mid-tier via email with follow-up calls, transactional via email with self-service FAQ.
Days 61–90: Price increase goes live. Weekly KPI tracking (realization, volume, exceptions, churn). Coach underperforming reps. Adjust retention tactics if churn exceeds the model. Conduct a 90-day retrospective to document actual outcomes vs. baseline and lessons for the next pricing action.
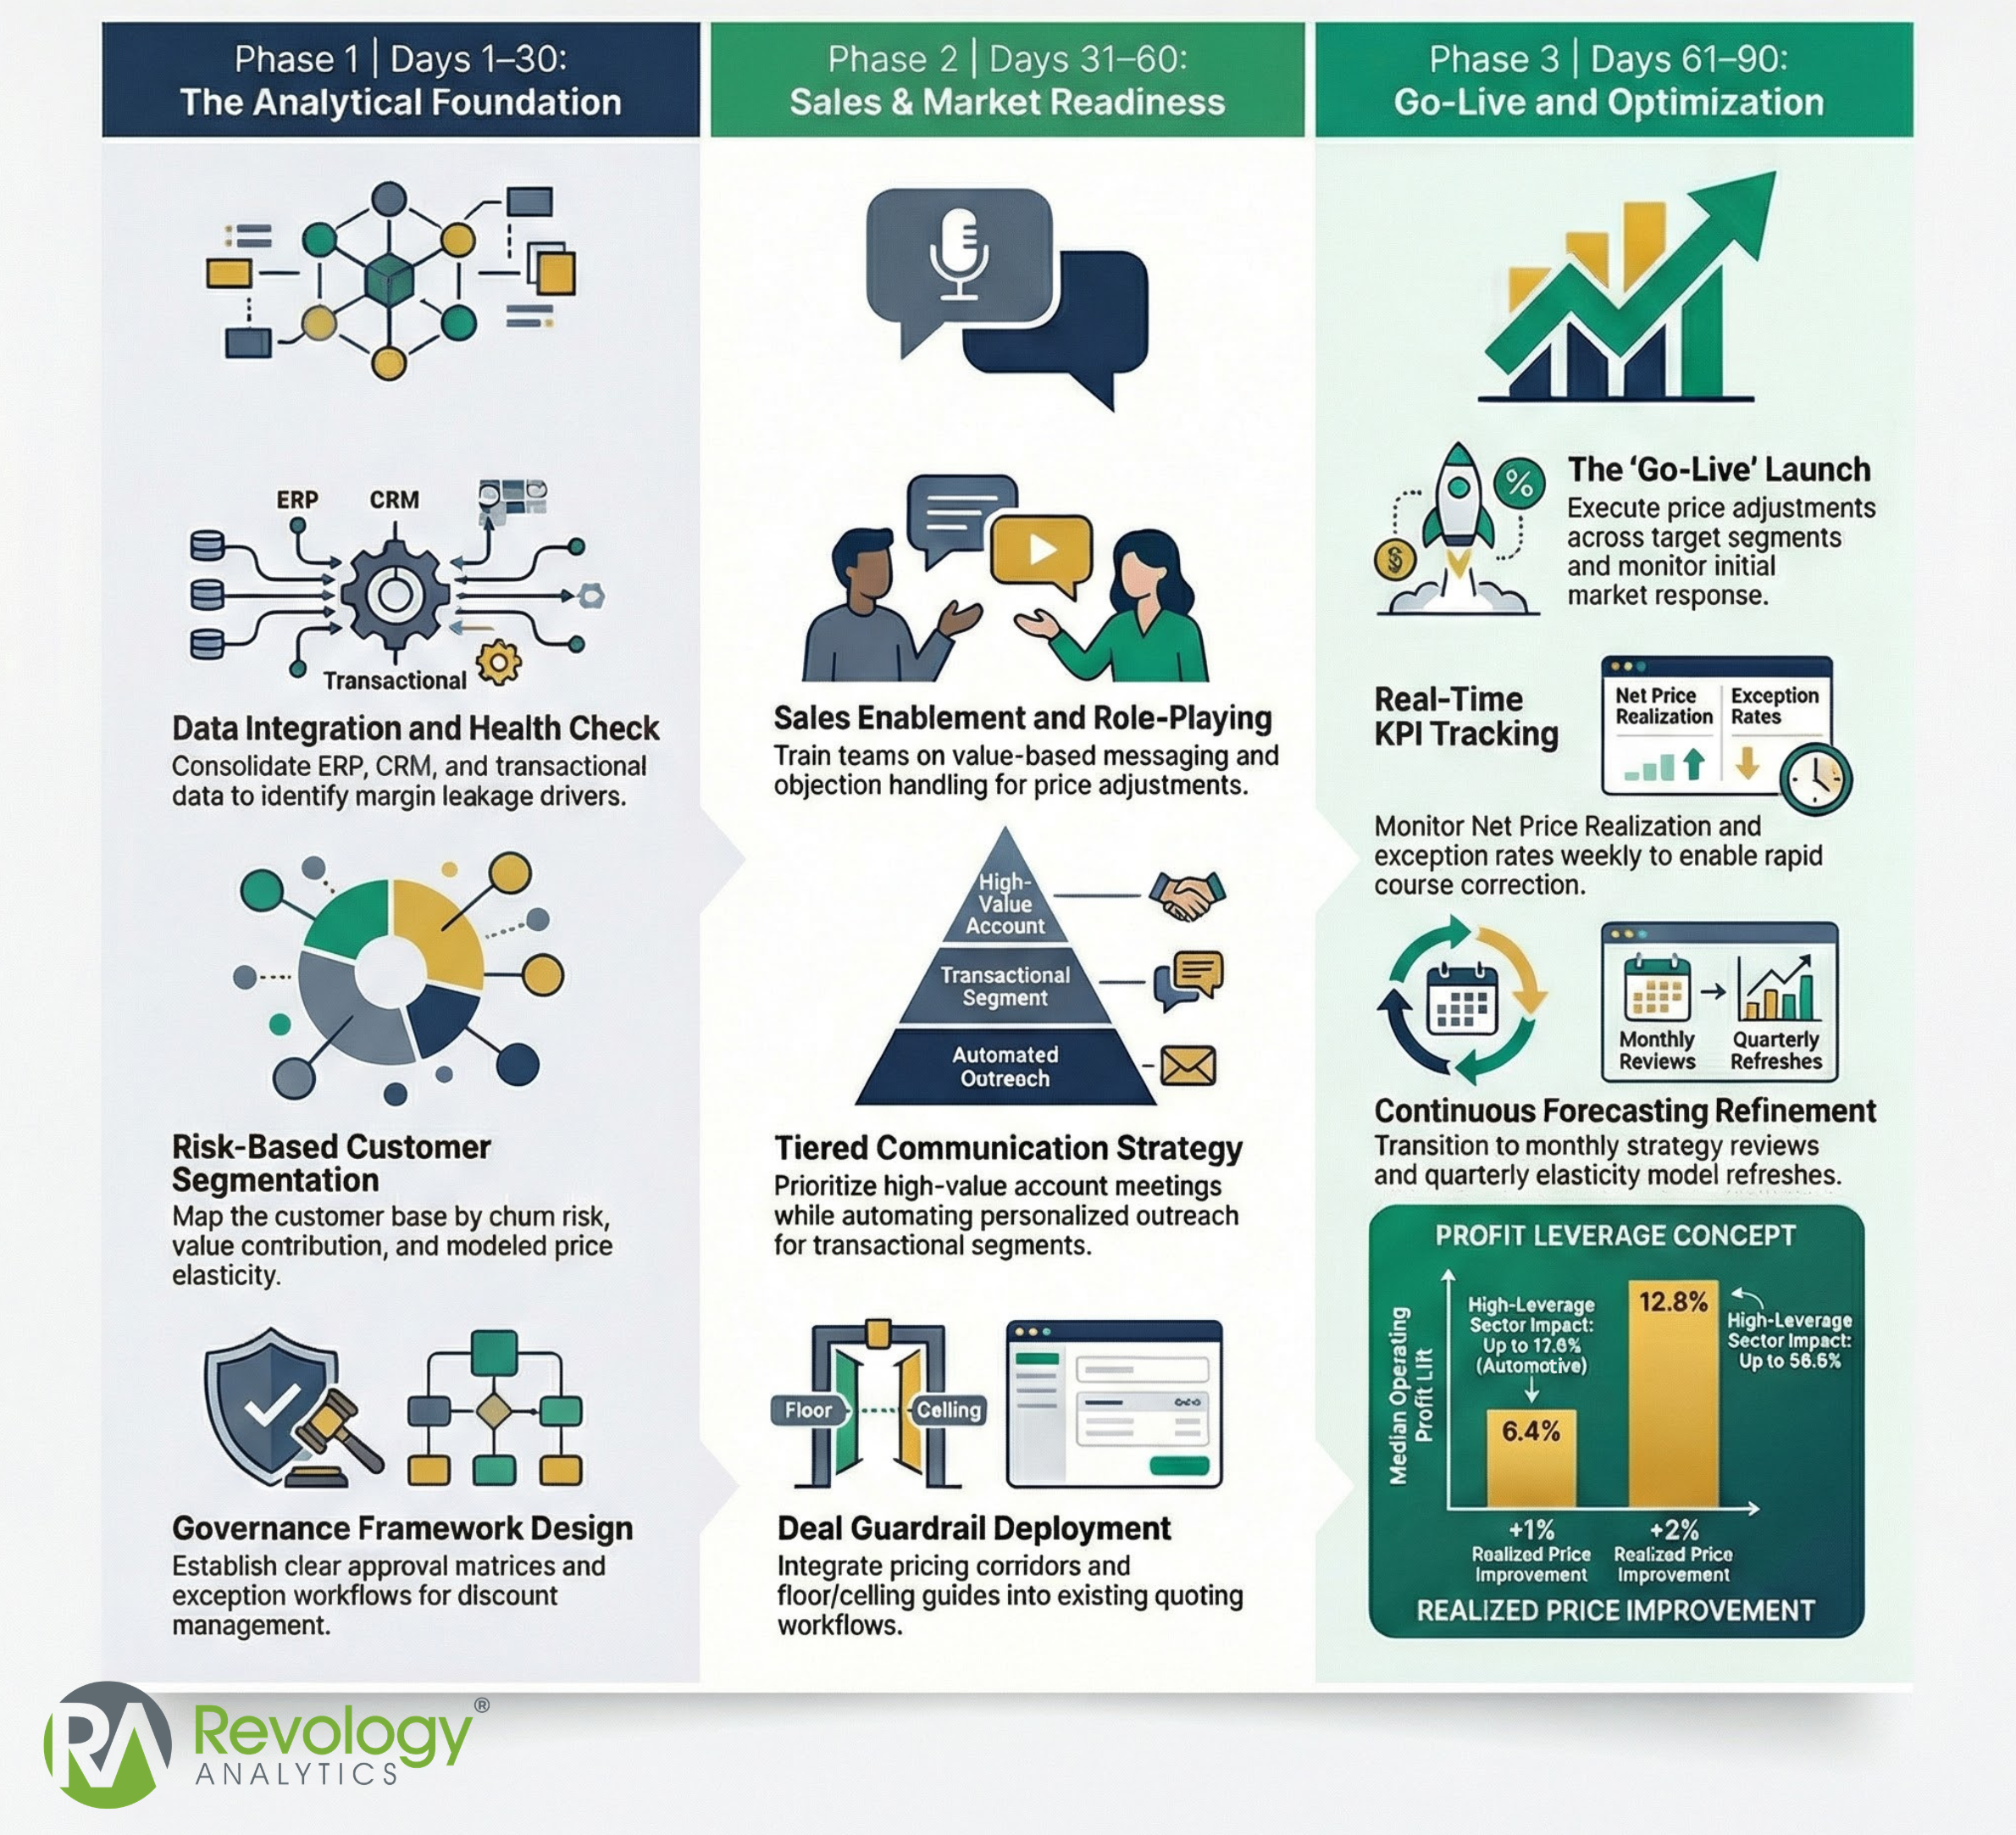
90 Days Road Map of Pricing Excellence
FAQ: Pricing Increase Questions
How do I announce a price increase to customers?
State the effective date, what is changing, who it applies to, and the business reason in one paragraph. Anchor on the value customers receive and provide a clear path for questions. Keep the message consistent across email, invoices, and account manager conversations.
How do you say prices are increasing?
Use direct language: “Effective [date], prices for [products/services] will increase by [X% or $Y].” Follow immediately with a value statement and any options available to customers (renew early, switch tiers, adjust quantities).
What do you mean by price increase?
A pricing increase is any change that raises the customer’s total price paid—including list price changes, reduced discounts, new fees or surcharges, packaging changes, or changes to terms that affect net price. The metric that matters is net price realization, not the change in list price.
Why are the prices going up?
Common drivers include higher input and labor costs, investments in service levels or product improvements, changes in demand/supply balance, and the need to align price with delivered value. The best explanation is specific to the customer’s context and the value they receive.
What are the 5 C’s of pricing?
Company (objectives and costs), Customers (willingness-to-pay and segments), Competitors (positioning and alternatives), Collaborators/Channels (distributors and partners), and Context (market conditions, regulation, macro environment). Use it as a diagnostic checklist before setting increased levels.
How do I announce prices?
Publish prices in a single authoritative location (price list, quote tool, or portal), align sales enablement materials, and communicate changes with an effective date and transition rules. For B2B, specify how quotes, contracts, and renewals are affected.
How much should we increase prices to avoid churn?
Set the increase by segment based on historical price-volume response, competitive alternatives, and value differentiation. If you lack elasticity estimates, start with a pilot on 15–20% of accounts, monitor churn for 60–90 days, then extrapolate.
Should we grandfather existing customers during a price increase?
Use grandfathering selectively for high-risk accounts with clear end dates and step-up schedules. Prefer structured transition offers (6–12 month ramp) over indefinite protection, which creates permanent price gaps and internal conflict.
What metrics should we track after a price increase?
Track price realization (invoice net price vs. target), churn and retention, downgrade rate, volume and mix shifts, win/loss reasons, and exception rate. Review weekly during rollout, monthly thereafter.
What’s the difference between the list price and net price in a price increase?
List price is the published starting point; net price is what customers actually pay after discounts, rebates, freight, fees, and terms. A successful pricing increase is measured by net price realization, not the list price change alone.
Subscribe to
Revology Analytics Insider
Revenue Growth Analytics thought leadership by Revology?
Use the form below to subscribe to our newsletter.